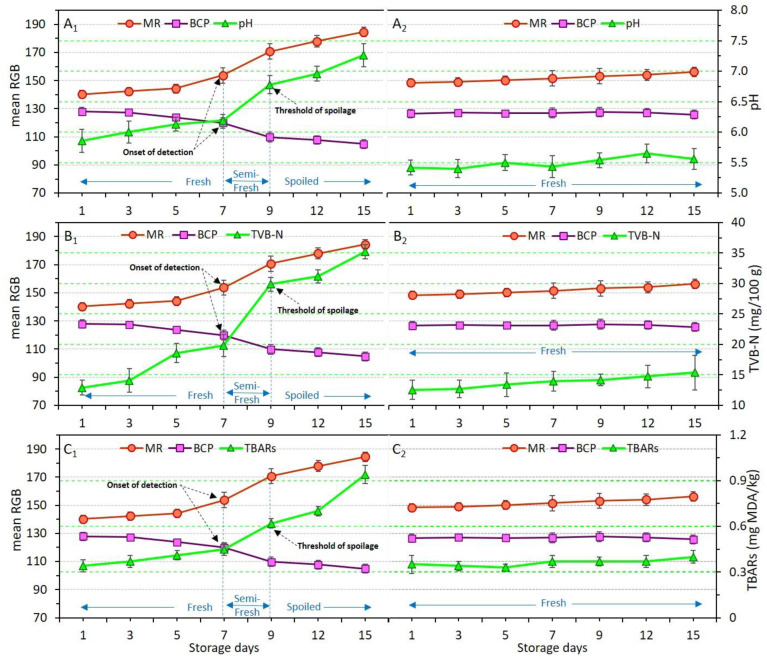
Figure 6.
Variations of pH (A), TVB-N (B), and TBARs (C) values in relation to dual-sensors color responses (measured as mean RGB) in chicken meat samples without coating (control, (A1–C1) and coated with chitosan incorporating YEO (Ch_2%—YEO_0.3%, (A2–C2)) during chilled storage days. Data are mean of at least triplicate measurements and error bars indicate SDs. MR: methyl red, BCP: Bromocresol purple. Onset of detection and threshold of spoilage in relation to pH, TVB-N, and TBARs values has been shown by black arrows.

