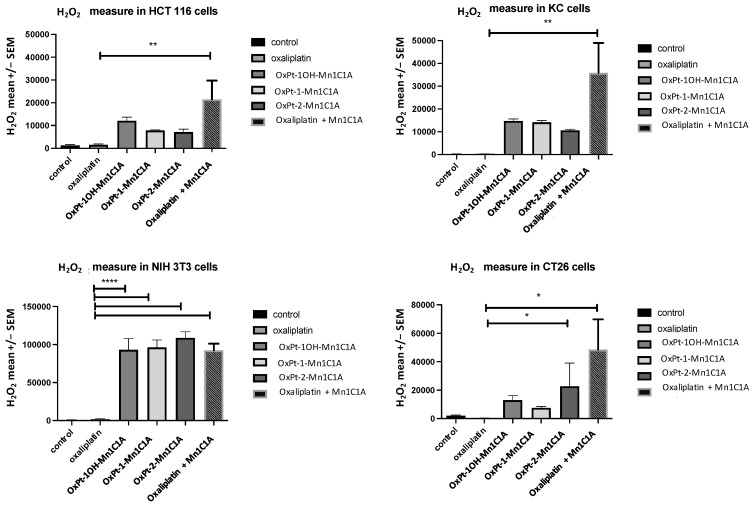
Figure 2.
H2O2 levels in vitro. Mean H2O2 levels (fluorescence intensity) as measured by spectrophotometry (H2-DCFDA) in cell lines treated with vehicle, oxaliplatin, OxPt-1OH-Mn1C1A, OxPt-1-Mn1C1A, OxPt-2-Mn1C1A, and Mn1C1A + oxaliplatin at 2.5 μM, 5 μM, and 10 μM for 24 h. The p-values are denoted as follows: * p < 0.05, ** p < 0.01, and **** p < 0.0001. H2O2 levels were higher in all cell lines with conjugate compounds or with Mn1C1A + oxaliplatin compared to oxaliplatin alone (p < 0.05).

