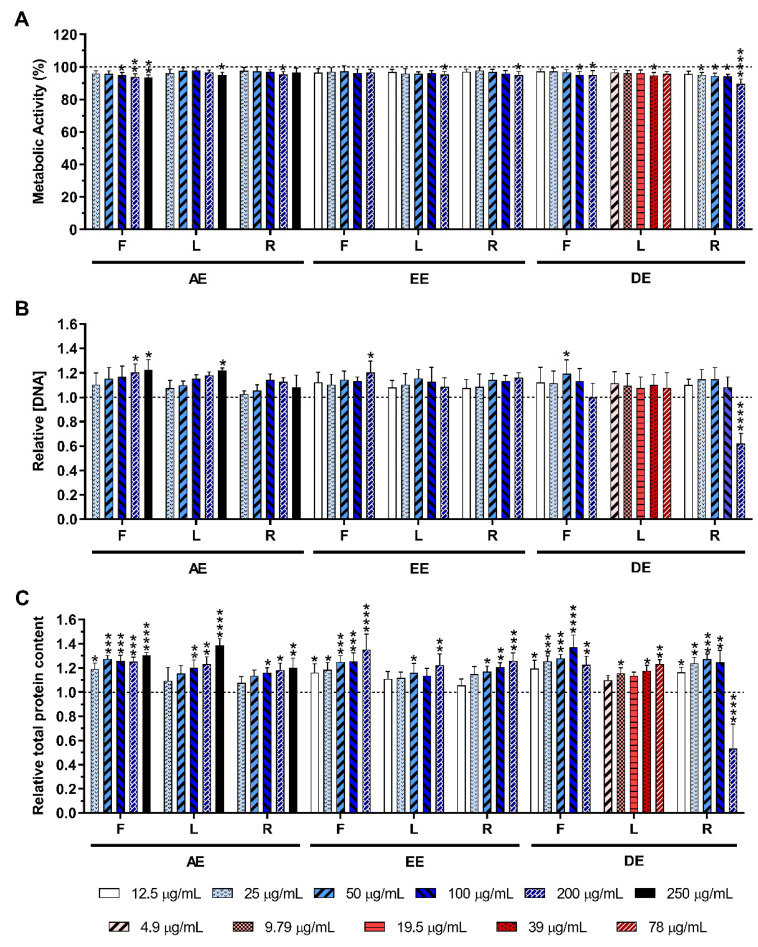
Figure 2.
Metabolic activity (A), relative DNA concentration (B) and relative total protein content (C) of non-stimulated macrophages cultured in the presence of different concentrations of the E. purpurea extracts for 24 h of culture. The dotted line represents the metabolic activity, DNA concentration, and total protein content of negative control (non-stimulated macrophages without treatment). Statistically significant differences are * (p < 0.0476), ** (p < 0.0096), *** (p < 0.0010), and **** (p < 0.0001) in comparison to the negative control (non-stimulated macrophages without treatment) for each different tested extract. F: flowers; L: leaves; R: roots; AE: aqueous extracts; EE: ethanolic extracts; DE: dichloromethanolic extracts.

