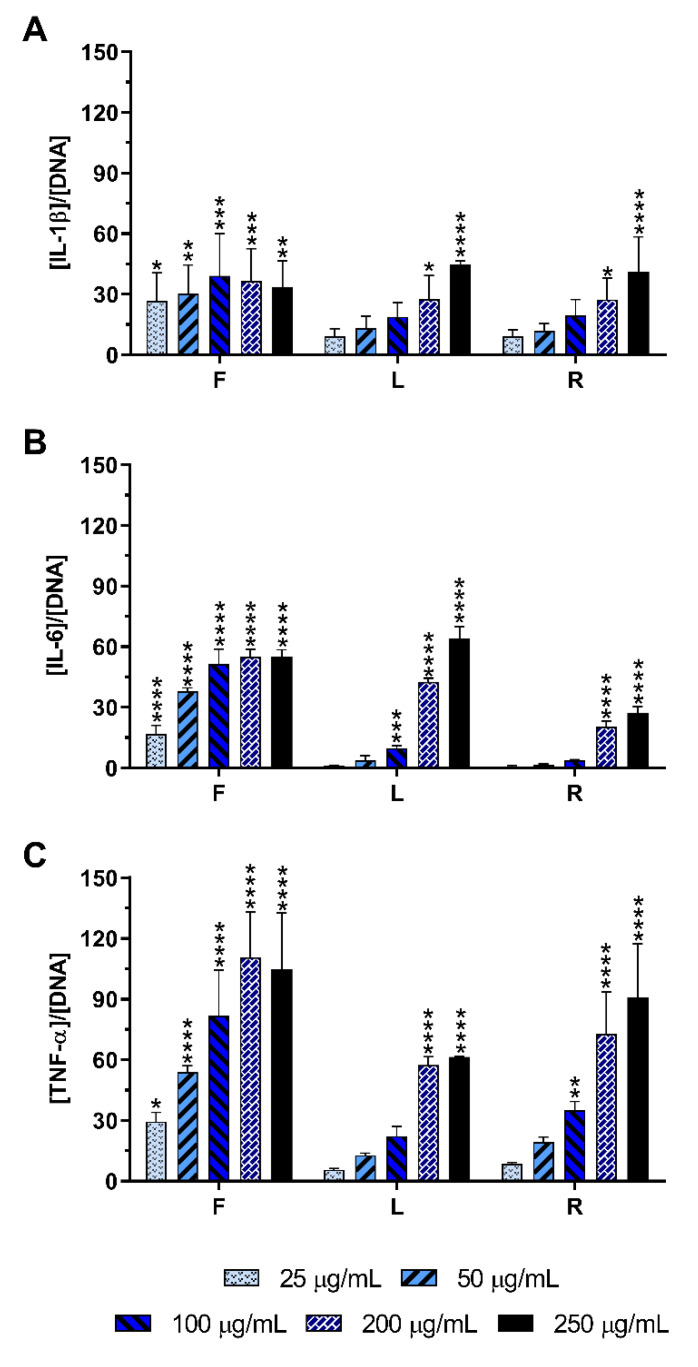
Figure 4.
IL-1β (A), IL-6 (B), and TNF-α (C) production by non-stimulated macrophages cultured in the presence of different concentrations of the AE obtained from E. purpurea for 24 h of culture. Statistically significant differences are * (p < 0.0376), ** (p < 0.0075), *** (p < 0.0006), and **** (p < 0.0001) in comparison to the negative control (non-stimulated macrophages without treatment) for each different tested extract. F: flowers; L: leaves; R: roots.

