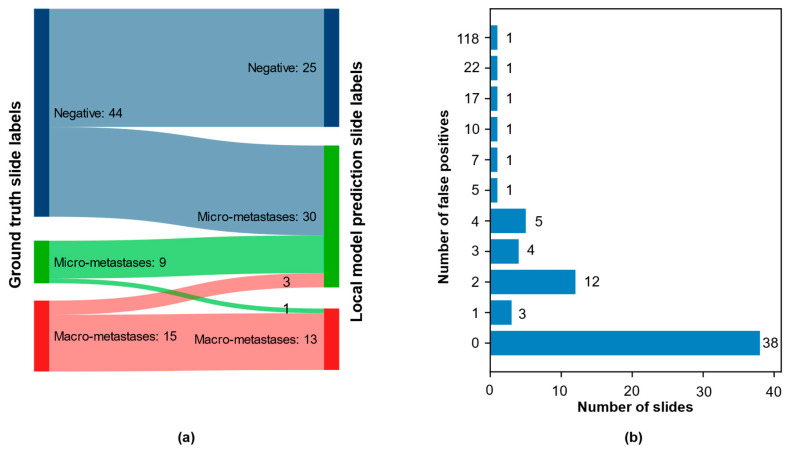
Figure 3.
Results from pathologist qualitative evaluation of local model predictions: (a) Sankey diagram over the combined test set (LocalSentinel + LocalAxillary), n = 68, with the ground-truth slide label on left side and local model prediction slide label on right side. Numbers represent the number of slides in each diagnosis group. (One negative slide in ground truth misclassified as negative); and (b) the distribution of false positive across the 68 slides: 38 slides had no false positive; most of the slides with false positives contained 1-4 false positive; a small number of slides had a large number of false positives.

