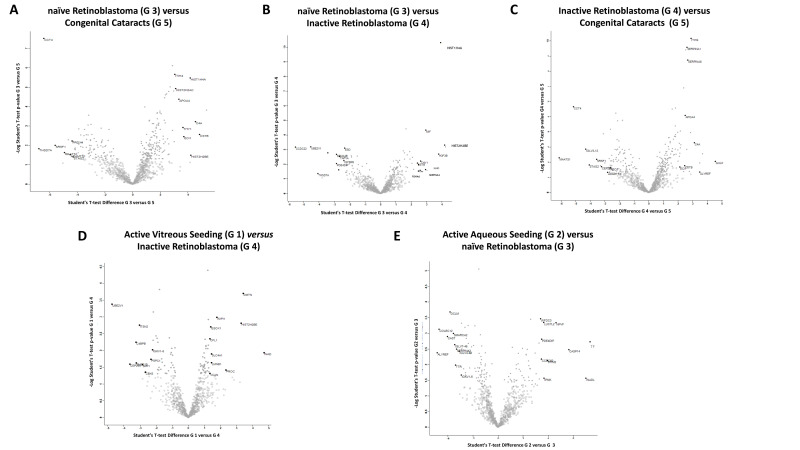
Figure 2.
Volcano plots showing abundance of differentially expressed proteins between two of the five groups at a time: (A) naïve RB compared to congenital cataracts; (B) naïve RB compared to inactive RB; (C) inactive RB compared to congenital cataracts; (D) active vitreous seeding compared to inactive RB; (E) active aqueous seeding compared to naïve RB. The black line shows p value = 0.05 and s0 = 0.1. Red dots depict proteins whose fold change is <2 (log2 = 1) or p > 0.05 between the two groups considered.

