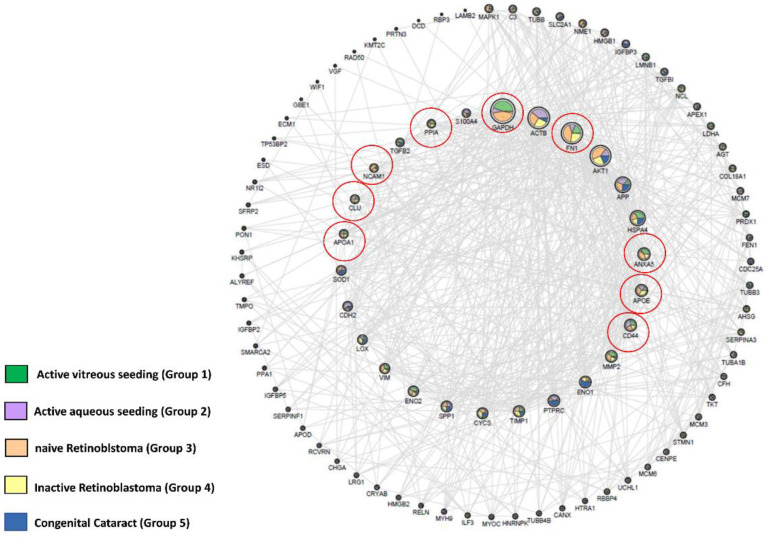
Figure 3.
The network represents the interactions between 96 genes coding proteins identified overlapping the polypeptides associated with RB, selected via Open Target, and the proteins identified in our study groups (including the congenital cataract group). The nodes have dimensions related to the degree of connection, and the internal circumference shows the most connected proteins, with a degree > 15. The outer circumference shows the less connected proteins (degree ≤ 15); therefore, of smaller dimensions. Connections are only present if the confidence level of the string is > 0.4. The coloring of the nodes is a function of the average intensity of each group measured in mass spectrometry, normalized for graphic reasons on a scale of 1–100. The coloring and the percentage distribution of the node were preformed using the layout tools in Image/Chart of Cytoscape.

