Figure 3.
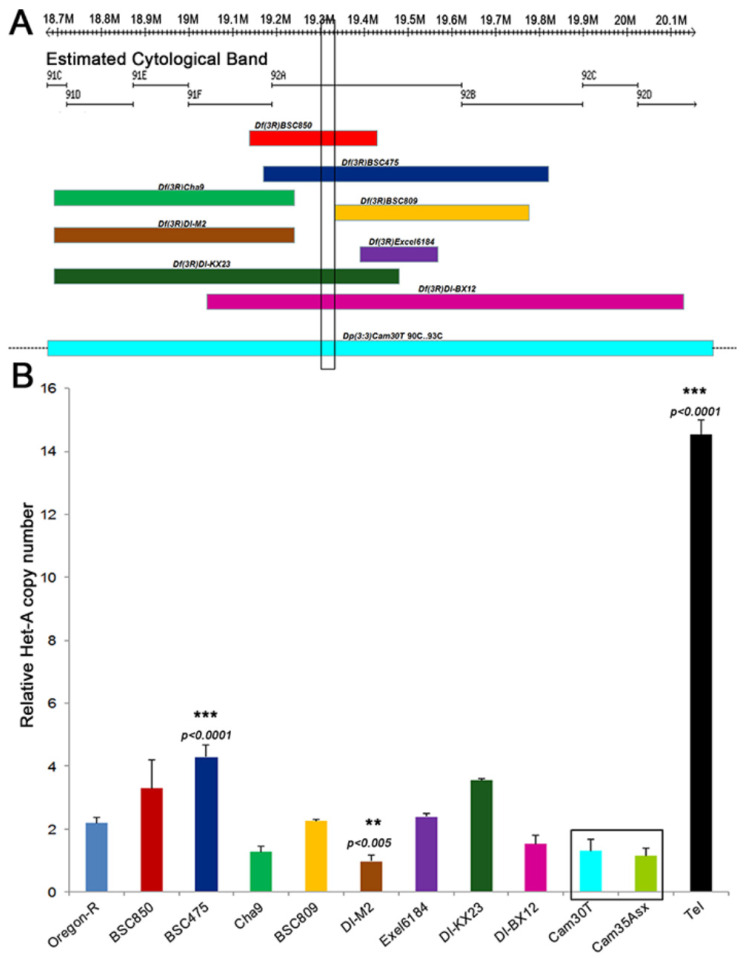
Dosage effects of Tel on HeT-A copy number. (A) The cytogenetic and physical map of genomic region 91C-91D is displayed, highlighting the 15 kb Tel1 region as a vertical box. The lower part of the panel shows the extent of chromosome deficiencies. The bottom rectangle, Dp(3:3)cam30T, is a duplication for this region. Dotted lines beyond this rectangle show that the duplication extends beyond the represented region. (B) Shows the relative HeT-A copy number in stocks of the aberrations shown in A. The highlighted box represents a duplication that includes mapped region (Dp(3;3)cam30T covers 90C-93C) and another duplication of a neighboring region of the genome (Dp(3;3)cam35 covers 67C5-69A5) as a control. The mean from three replicates is represented here and error bars represent standard deviation. ** p < 0.005; *** p < 0.0001, one-way ANOVA with Sidak correction.

