Figure 8.
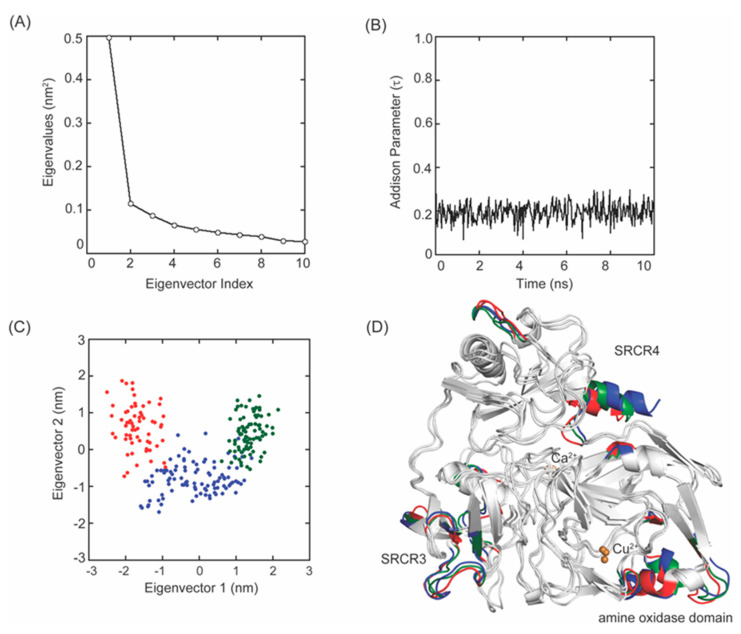
MD–simulation of the 2HP–inhibited Δ1–2SRCR–LOXL2. (A) A plot of eigenvalues versus the first 10 eigenvector indices obtained from the covariance matrix of Cα atoms over a stable trajectory of 10 ns of MD–simulation. (B) A plot of the Addison parameter (τ) values of the active site Cu2+ during 10 s MD–simulation indicates a square pyramidal coordination geometry. (C) Projection of the motion of Cα atoms of Δ1–2SRCR–LOXL2 along the first two principal eigenvectors during 0–1.08 ns (in red), 1.12–4.96 ns (in blue), and 5–10 ns (in green). (D) The Cα atoms corresponding to those in (C) are highlighted in the same colors.

