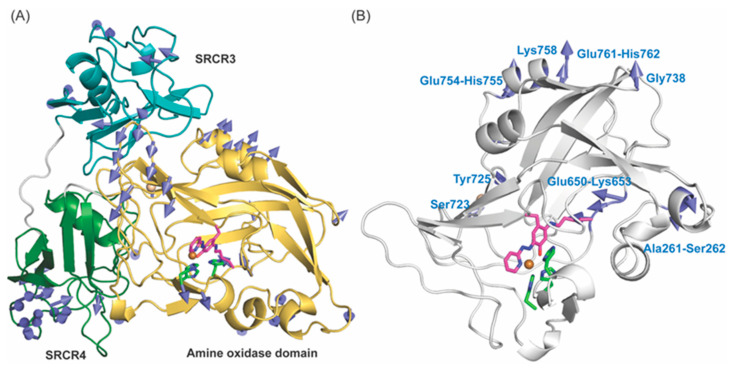
Figure 9.
Displacement of the Cα atoms in 2HP–inhibited Δ1–2SRCR–LOXL2 (A) and the amine oxidase domain of 2HP–inhibited LOXL2 (B) where regions of peptides/amino acids exceeding 3Å (A) or 2.5Å (B) are visualized by vectors (in teal). In (A), SRCR3 and SRCR4 domains are in cyan and in green, respectively, and the amine oxidase domain is in yellow. The structures shown are in the very first phase and vectors indicating the difference between the first and the last phase of MD–simulation.

