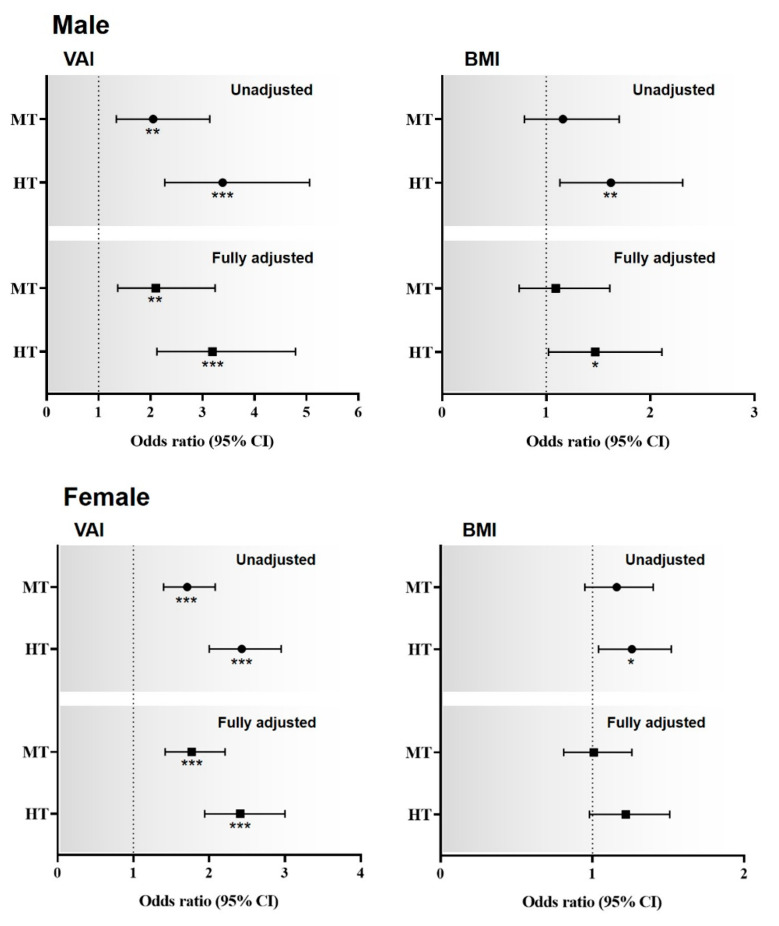
Figure 3.
Sex-specific odds ratios for the relationships of MSCKD with the VAI and BMI Z-scores. Dotted line: reference; solid line: 95% confidence interval; Black circle: odds ratio. * p < 0.05, ** p < 0.01, *** p < 0.001 for the odds ratios for MSCKD, compared with the lowest tertiles. Abbreviations: HT, highest tertile; MT, middle tertile. VAI = visceral adiposity index; BMI = body mass index.

