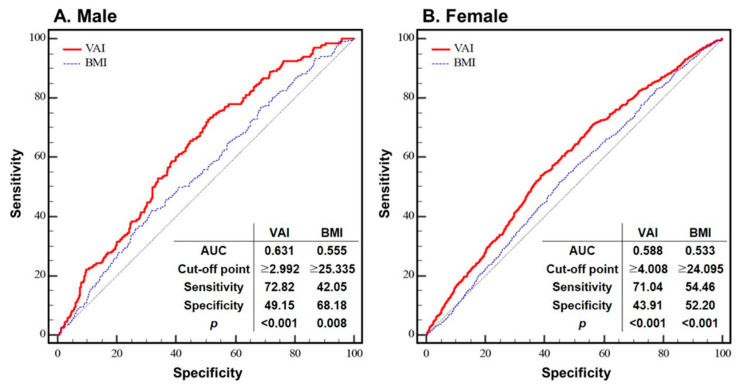
Figure 4.
The ROC curves of the VAI and BMI plotted against MSCKD for each sex. Thin black line: reference; solid red line: area under the curve (AUC), indicating the accuracy of the VAI for the identification of MSCKD; thin dotted blue line: area under the curve (AUC), indicating the accuracy of the BMI for the identification of MSCKD; cut-off point: the value of VAI or BMI that predicts MSCKD; sensitivity: the probability of individuals who actually have MSCKD to be predicted to have MSCKD; specificity: the probability of individuals who do not have MSCKD to be predicted not to have MSCKD. Abbreviation: VAI = visceral adiposity index; BMI = body mass index; AUC = area under curve.

