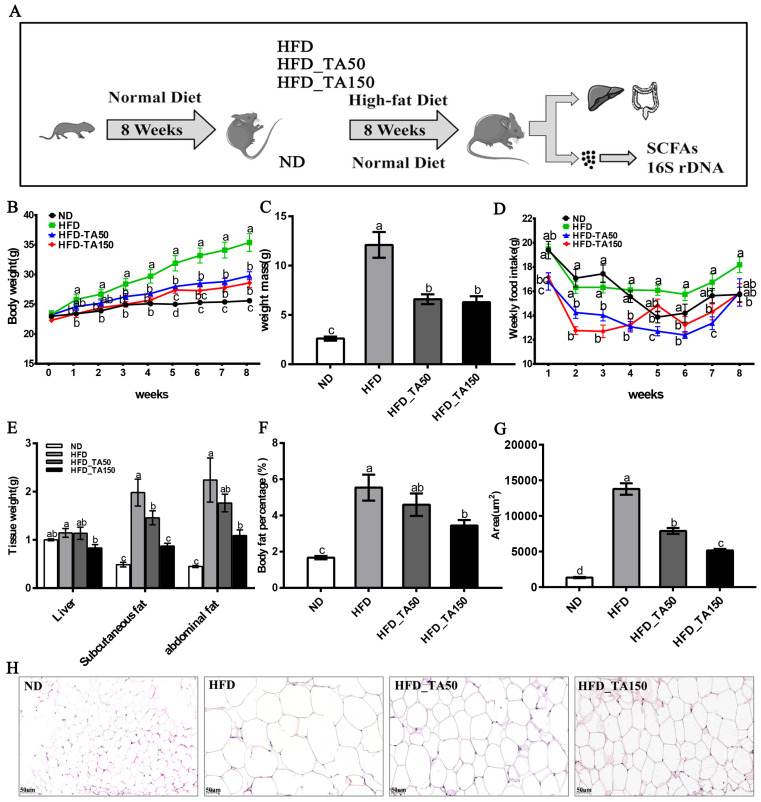
Figure 1.
Effect of dietary tannic acid on body weight, fat mass and adipocyte morphology in mice induced by high-fat diet. (A) Timeline depicting the treatment of tannic acid, (B) body weight, (C) weight mass, (D) weekly food intake, (E) tissue weight, (F) body fat percentage, (G) lipid drops area, (H) epididymal adipose tissue morphology. ND: normal diet, HFD: high-fat diet, HFD_TA50: 50 mg/kg/d tannic acid intervention, HFD_TA150: 150 mg/kg/d tannic acid intervention. Data are expressed as the mean ± SEM. Different letters between any two groups indicated that there was significant difference between the two groups (p < 0.05).

