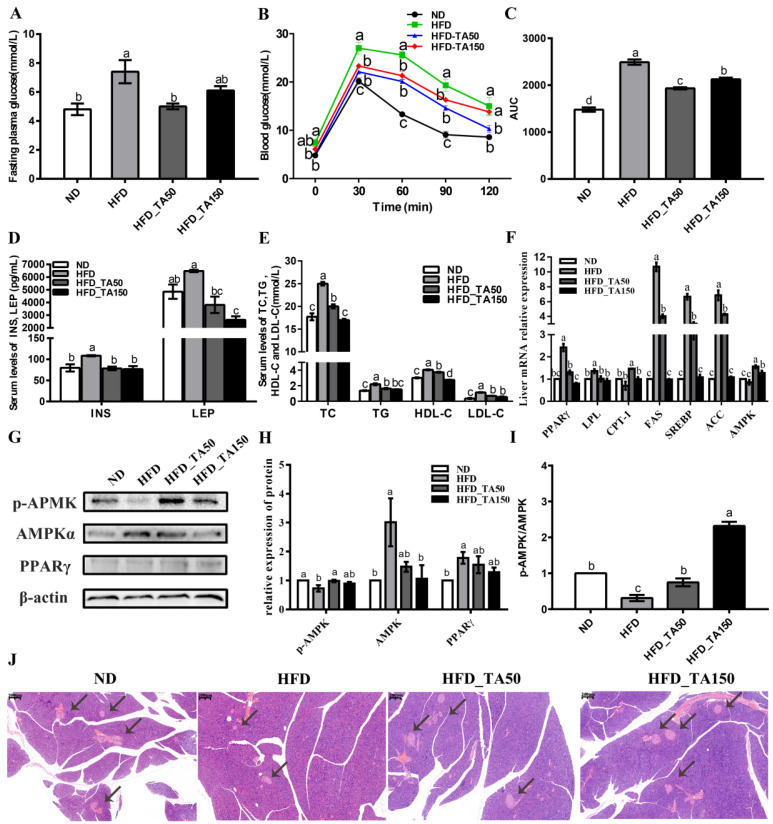
Figure 2.
Effect of dietary tannic acid on the glucolipid metabolism in mice induced by a high-fat diet. (A) Fasting plasma glucose, (B) blood glucose, (C) area under curve of OGTT, (D) serum INS and LEP, (E) serum levels of TC, TG, HDL-c and LDL-c, (F) relative expression of mRNA levels in the liver, (G) Western blot of hepatic AMPKα, p-AMPK and PPARγ, (H) relative expression of hepatic AMPKα, p-AMPK and PPARγ, (I) p-AMKP/AMPK, (J) H&E staining of pancreatic tissues. Black arrows indicate the pancreas islets. INS: insulin, LEP: leptin, TC: serum cholesterol, TG: serum triglyceride, HDL-c: high-density-lipoprotein cholesterol, LDL-c: low-density-lipoprotein cholesterol. Data are expressed as the mean ± SEM. Different letters between any two groups indicated that there was significant difference between the two groups (p < 0.05).

