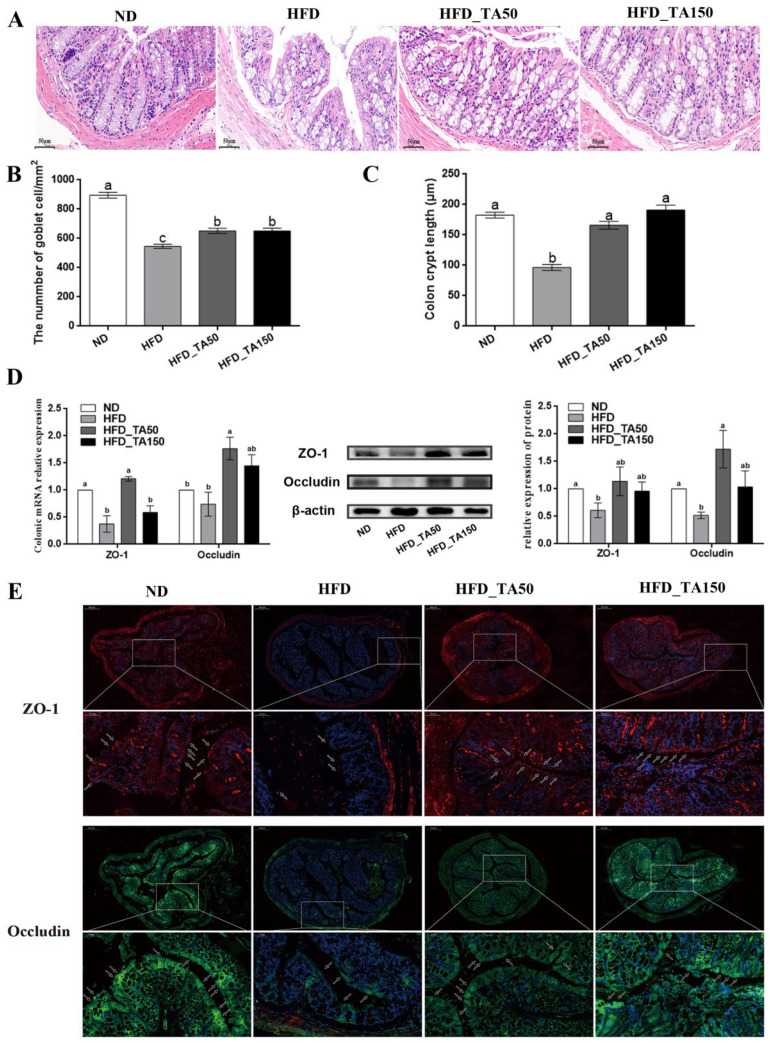
Figure 4.
Effect of dietary tannic acid on the intestinal barrier in mice induced by high-fat diet. (A) Representative colon H&E staining images, (B) the number of goblet cells, (C) colon crypt length, (D) colon ZO-1 and Occludin mRNA and protein expression measured by qRT-PCR and Western blot, (E) representative images of immunofluorescence in colon tissues with antibodies against ZO-1 and Occludin. Data are expressed as mean ± SEM. Different letters between any two groups indicated that there was significant difference between the two groups (p < 0.05).

