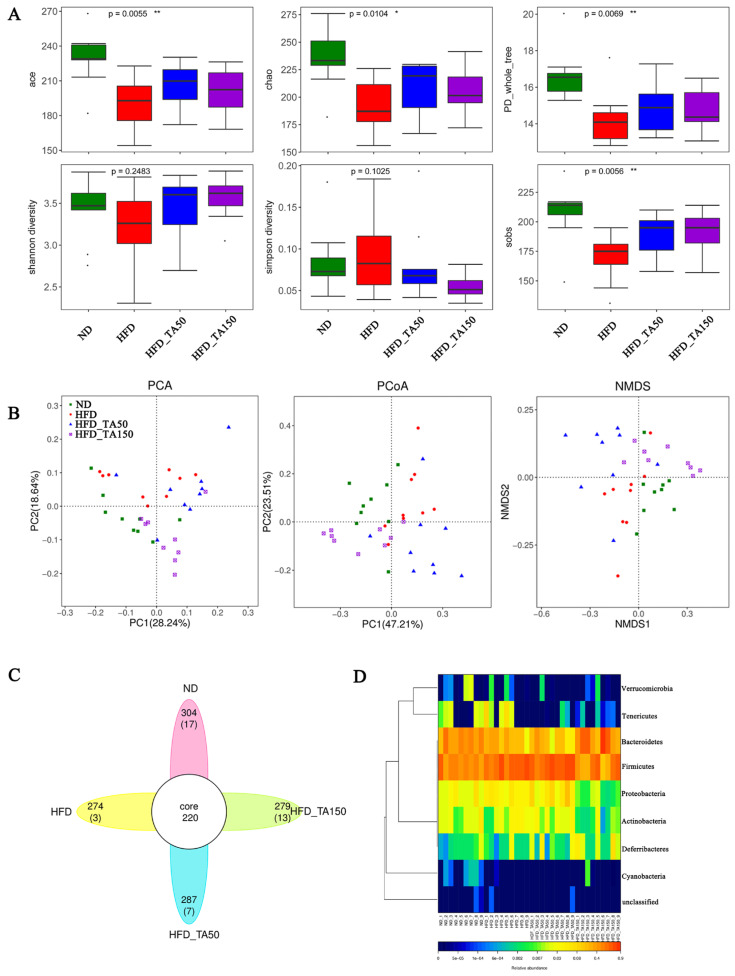
Figure 5.
Effect of dietary tannic acid on gut microbial diversity. (A) The alpha diversity analysis (ace, chao, PD_whole_tree, Shannon diversity, Simpson diversity, sobs), (B) the beta diversity analysis (PCoA, PCA and NMDS), (C) Venn diagrams, (D) heatmap on phylum level. Data are expressed as mean ± SEM. Significant correlations are marked by * p < 0.05 and ** p < 0.01.

