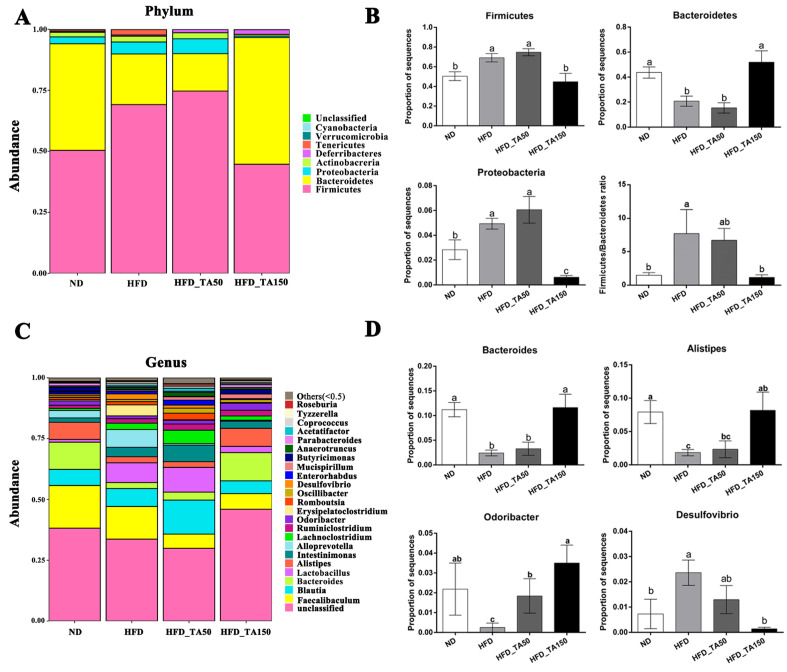
Figure 6.
Effect of dietary tannic acid on the composition of gut microbiota at the phylum and genus level. (A) Taxonomic distribution at the phylum level, (B) relative abundance of Firmicutes, Bacteroidetes, Proteobacteria, and Firmicutes/Bacteroidetes ratio, (C) taxonomic distribution at the genus level, (D) relative abundance of Bacteroides, Alistipes, Odoribacter and Desulfovibrio. Data are expressed as mean ± SEM. Different letters between any two groups indicated that there was significant difference between the two groups (p < 0.05).

