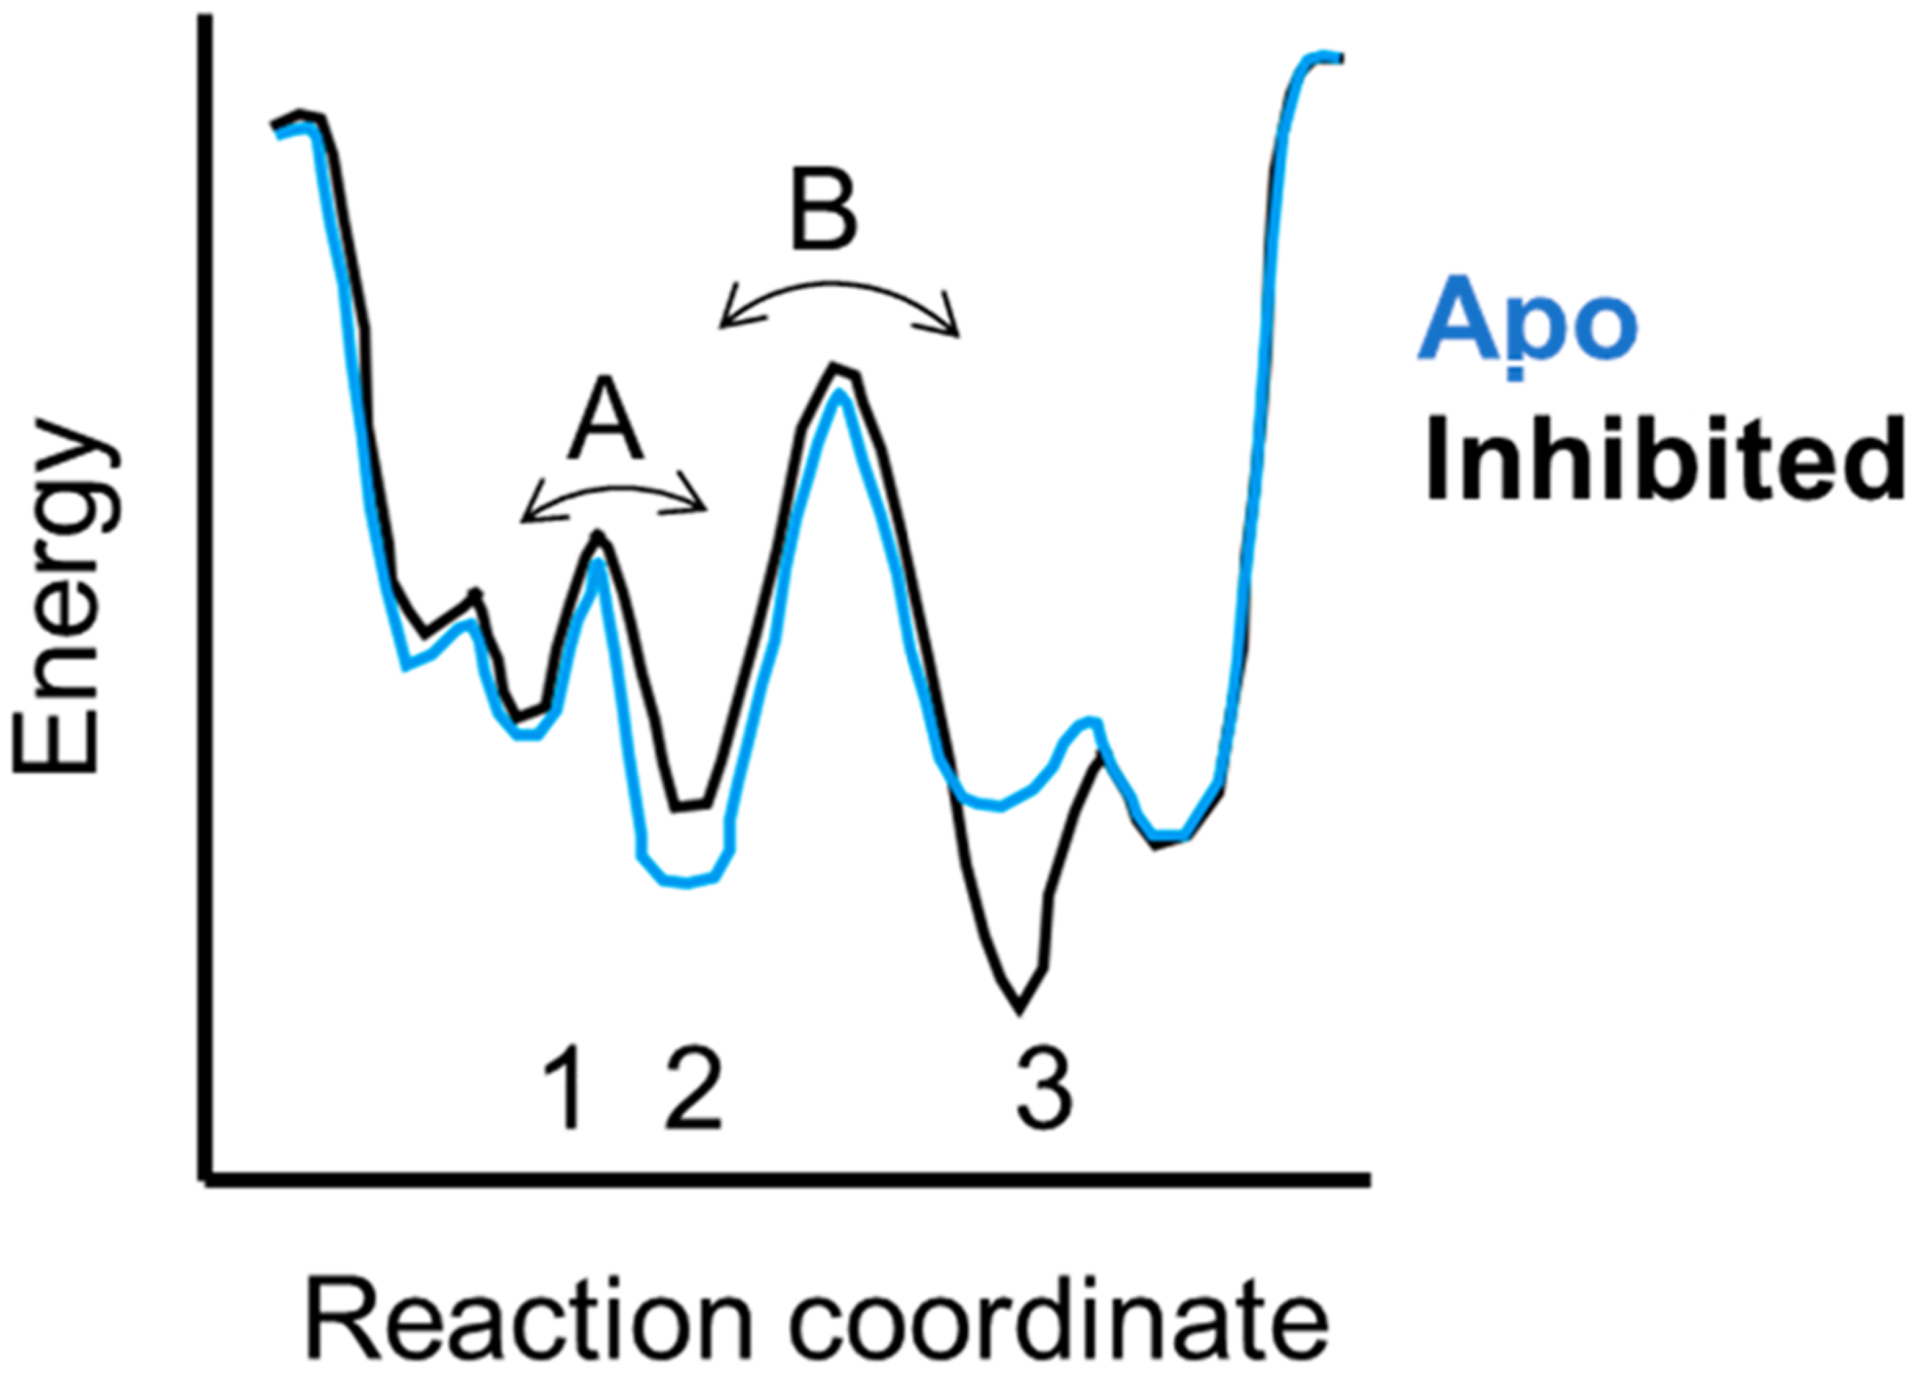
Figure 1.

Energy landscape diagram showing three states (1–3) that are separated by two energy barriers (A and B). States 1 and 2 are close in energy, so that most experimental measurements will report the average between them. States 2 and 3 are separated by a larger energy barrier, and their interconversion will occur on the microsecond to millisecond time scale and can be measured by NMR relaxation dispersion or HDX-MS experiments. States such as 2 and 3 are typically stabilized or destabilized by binding of allosteric ligands.
