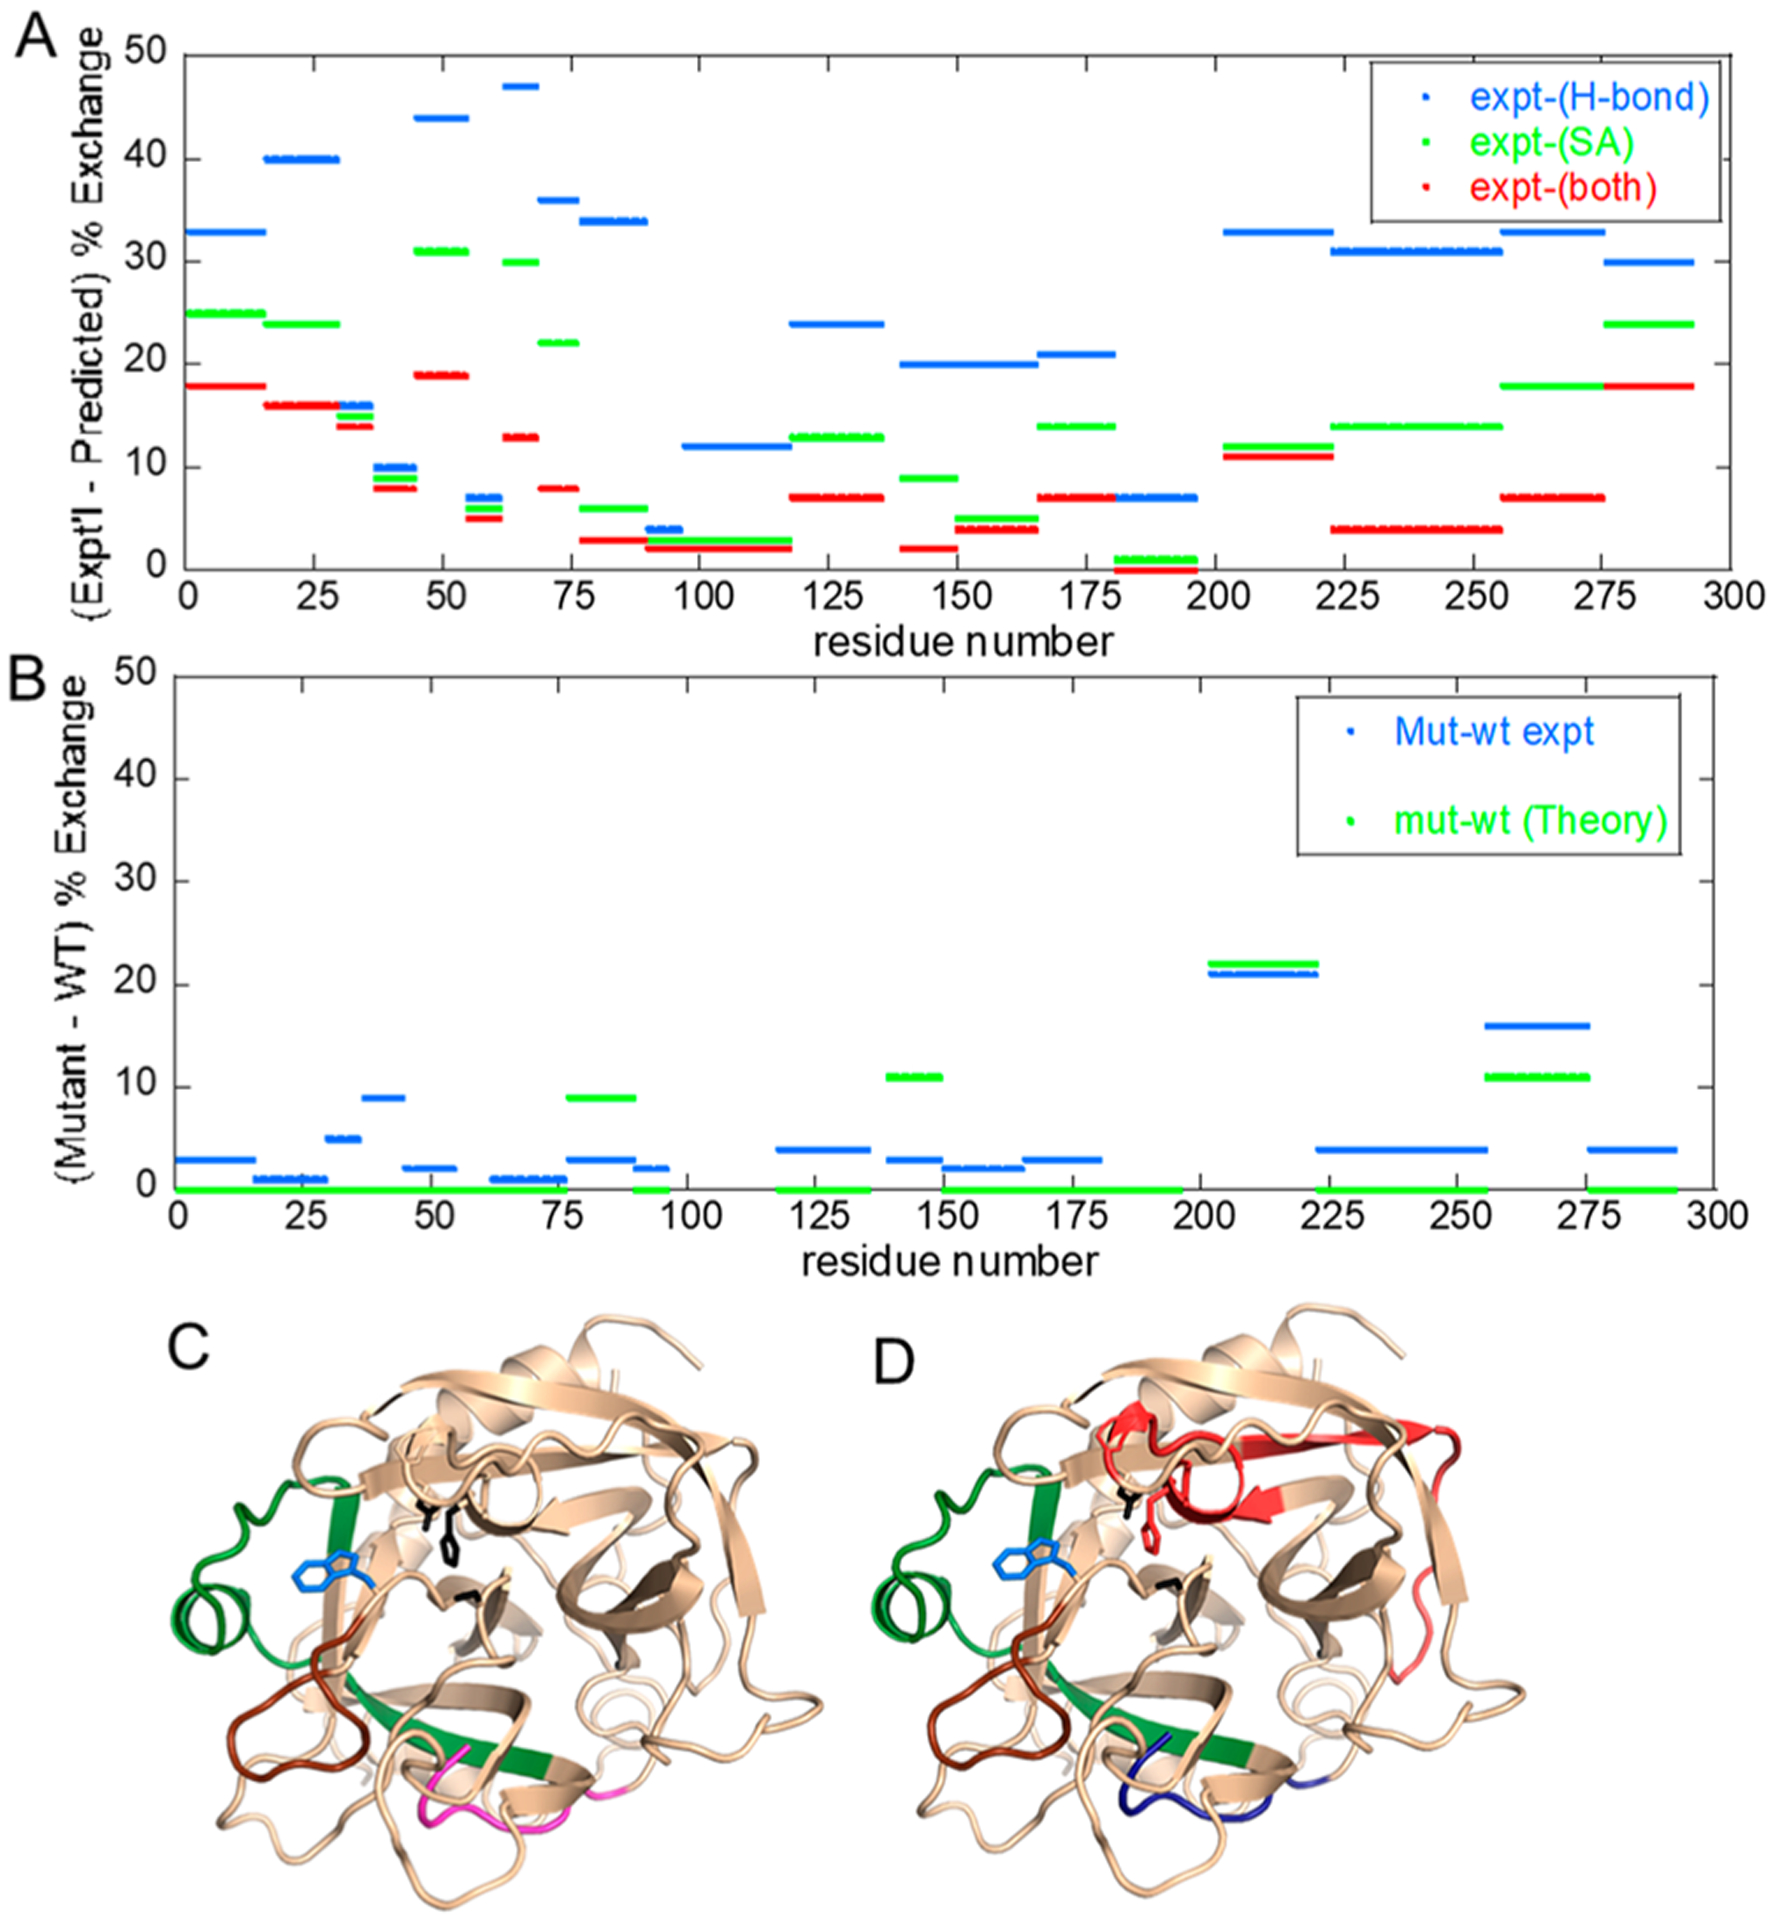
Figure 4.

Data from ref 41 in which aMD simulations were performed and then solvent accessibility and H-bonding were evaluated across the simulation. (A) Plot of the difference between experimental and predicted amide exchange for wild-type thrombin. The aMD simulations recapitulate the amide exchange best when both H-bonding (blue) and solvent accessibility (green) are combined in the computation of amide exchange (red). (B) Plot of the difference between experimental and predicted amide exchange for the W215A mutant thrombin. The amide exchange for the mutant differs primarily from the wild type at the 170s (sequential residues 200–225) and 220s (sequential residues 255–275) loops. The theory and experiment agree well for these two loops. (C) Structure of thrombin showing the regions of thrombin (180s loop, green; 220s loop, brown; N-terminus of the heavy chain, magenta) that are allosterically affected by the mutation of W215 (blue sticks). (D) The aMD simulations overestimated the dynamics of the region of thrombin (red) as compared to experiment, and they underestimated the dynamics of the N-terminus of the heavy chain (blue).
