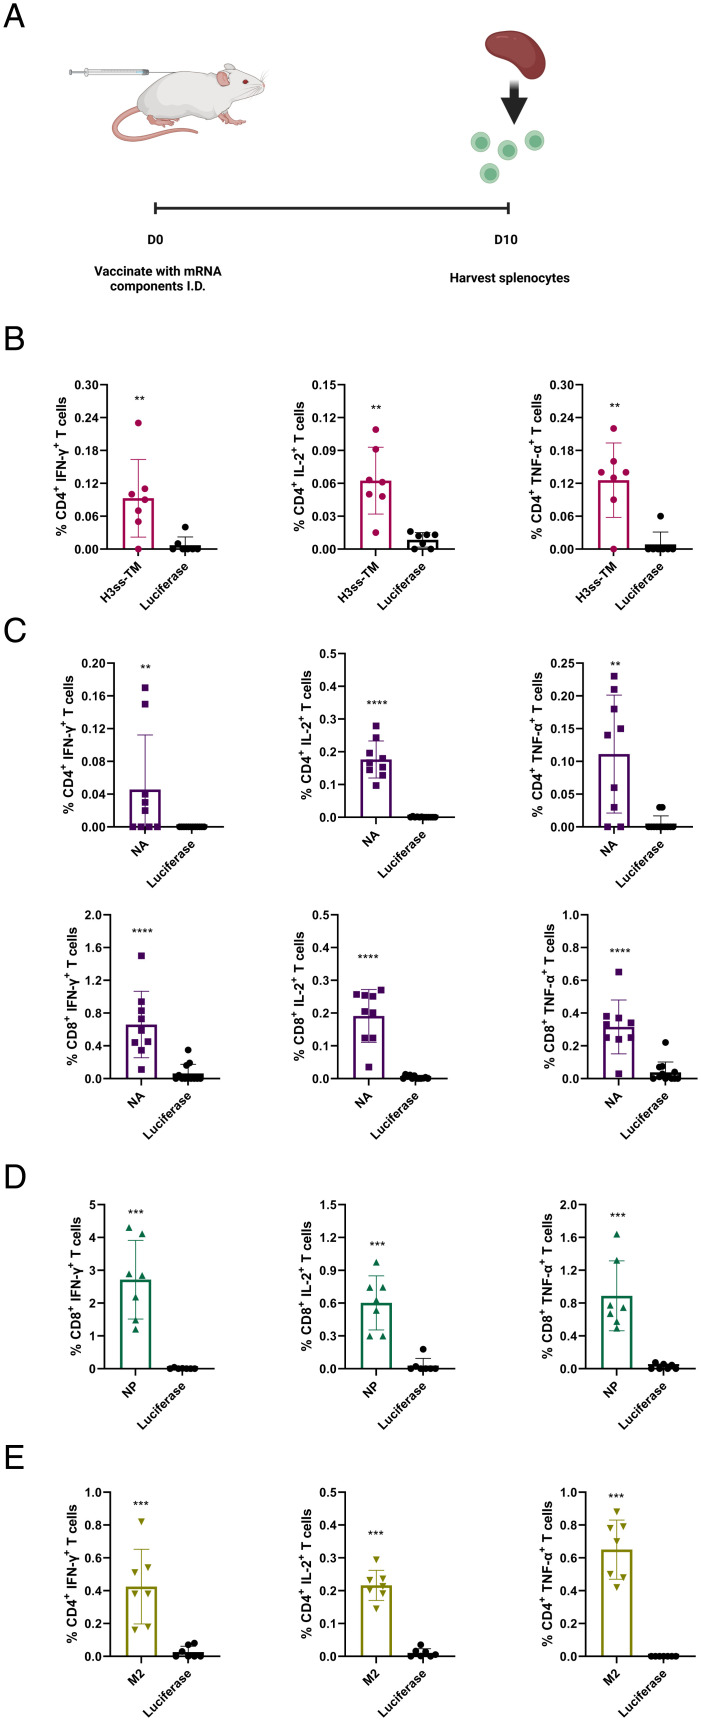
Fig. 3.
Cellular immune responses induced by influenza group 2 mRNA-LNP vaccines. Mice were vaccinated ID with a single dose of 5 μg of H3ss-TM (HA), NA, NP, M2, or control luciferase mRNA-LNPs. Splenocytes collected from immunized animals 10 d after immunization were stimulated with NP or M2-specific immunodominant MHC class I-restricted and MHC class II-restricted peptides, respectively, or NA or HA overlapping peptide pools, and cytokine production by CD4+ and CD8+ T cells was assessed by flow cytometry. (A) Schematic illustration of the experiment. (B) Percentages of cytokine producing HA-specific CD4+ T cells. (C) Percentages of cytokine producing NA-specific CD4+ (Upper panels) and CD8+ (Lower panels) T cells. (D) Percentages of cytokine producing NP-specific CD8+ T cells. (E) Percentages of cytokine producing M2-specific CD4+ T cells. Each symbol represents one animal and error is shown as SEM (n = 6 to 9 mice per group). Statistical analysis: two-tailed unpaired t test, *P < 0.05, **P < 0.01, ***P < 0.001, ****P < 0.0001.

