Fig. 2.
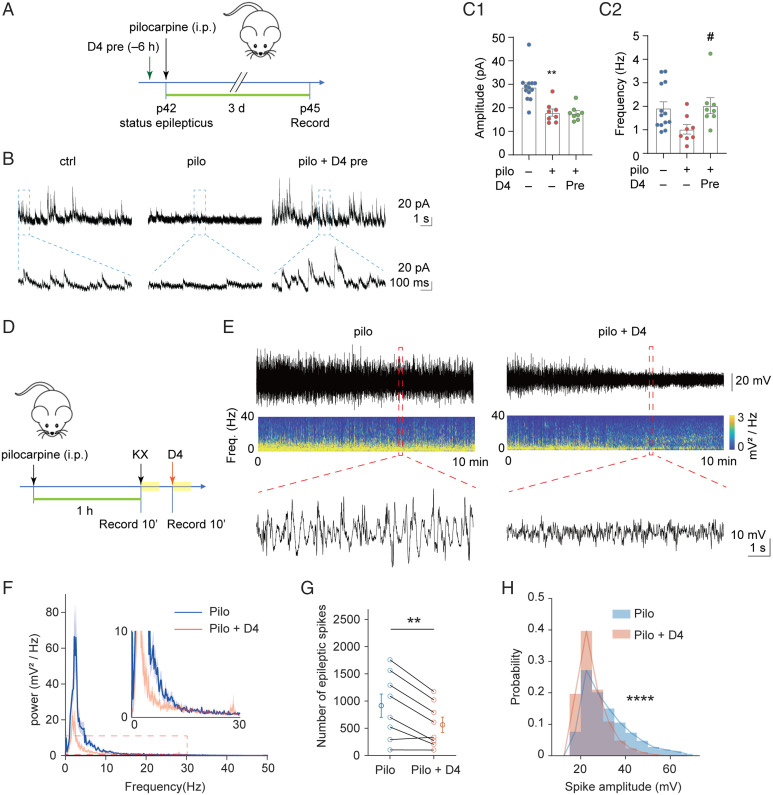
D4 attenuates altered synaptic inhibition and electrographic seizures. (A) Timeline of whole-cell patch-clamp recording. SE was induced in P42 wild-type mice by intraperitoneal injection of pilocarpine (200 to 300 mg/kg), D4 was administered by gavage 6 h (10 to 20 mg/kg) before pilocarpine injection. Three days after SE, mice were killed for further whole-cell patch-clamp recording. (B) Representative trace of sIPSCs in CA1 pyramidal neurons within 10 s (Above) and 1s (Below) scale. (C) Quantification of mean amplitude (ctrl: 28.8 ± 1.8 pA, n = 13; pilo: 18.0 ± 1.6 pA, n = 8, P = 0.002; pilo + D4 pre: 17.7 ± 1.1 pA, n = 8, P = 1.000) (C1) and frequency (ctrl: 1.9 ± 0.3 Hz, n = 13; pilo: 1.02 ± 0.20 Hz, n = 8, P = 0.08; pilo + D4 pre: 2.03 ± 0.34 Hz, n = 8, P = 0.035) (C2) of sIPSCs in CA1 pyramidal neurons. **P < 0.01: significant decrease compared with ctrl; #P < 0.05: significant increase compared with pilo. Independent-samples Kruskal–Wallis test (significance values were adjusted by the Bonferroni correction). (D) Scheme of experiment for D4 treatment in pilocarpine induced acute epileptic mice. First arrow denotes p42, status epilepticus. The yellow blocks represent the recording period. (E) Representative raw LFP and LFP spectrogram during pilocarpine induced SE in pilocarpine group and pilocarpine with D4 group. Below are enlarged raw LFP segments corresponding to the red dotted boxes. (F) Power spectral analysis of pilocarpine group and pilocarpine with D4 group. Thick dark lines indicate mean and shaded light-colored areas indicate SEM. (G) Effect of D4 on the number of epileptic spikes during 10-min recording. Paired t test, **P < 0.01. (H) D4 reduced the amplitude of epileptic spikes (rank-sum test, ****P < 0.0001) and altered their distribution shapes (two-sample Kolmogorov–Smirnov test, ****P < 0.0001).

