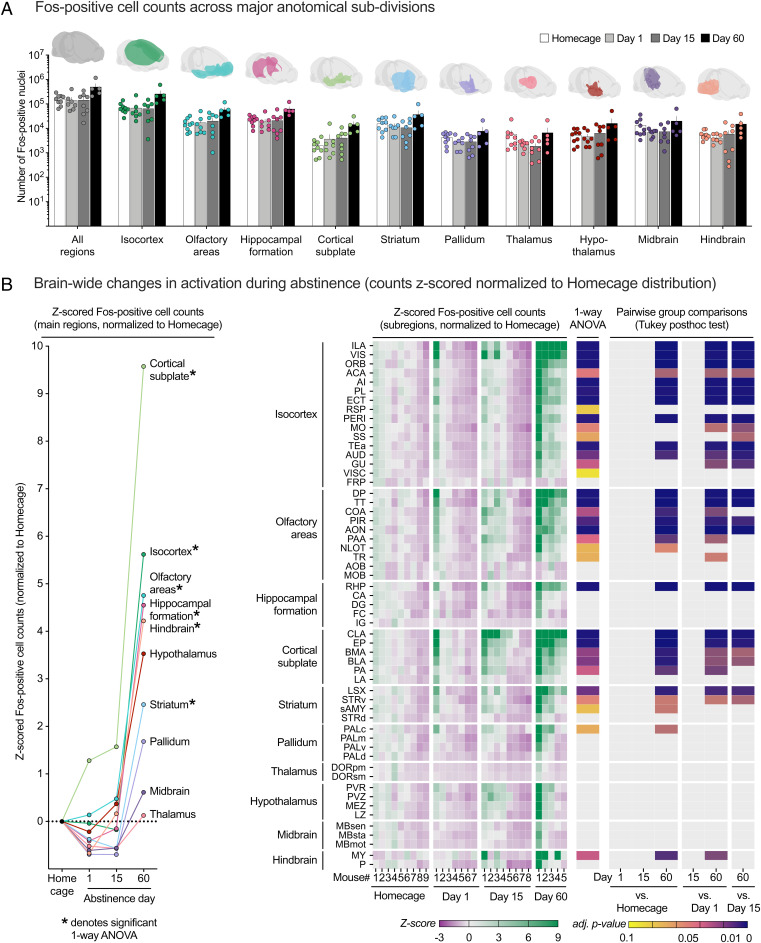
Fig. 2.
Unbiased brain-wide activity mapping of incubated relapse to palatable food seeking using ClearMap. (A) Mean (± SEM) Fos+ cell counts across the whole brain and for 10 major anatomical subdivisions. (B) Brain-wide changes in activation during abstinence. Raw Fos+ cell counts for each region are z-score-normalized to the homecage group distribution for statistical analysis. Mean z-scored cell counts for 10 major anatomical subdivisions showing time-dependent changes in activation pattern in multiple brain regions induced by the relapse tests (Left). *Significant differences (FDR-adjusted P < 0.1) one-way ANOVA. Heat map of individual z-scored Fos+ cell counts, one-way ANOVA FDR-adjusted P values, and Tukey’s HSD pairwise group comparison P values for 56 subregions across the analyzed brain volume (Right). Individual data are sorted by group and ranked in descending order of activation level within each group. Subregions are organized by 10 parent anatomical subdivisions and ranked in descending order of mean day-60 group activation level. See Dataset S2 for a detailed listing of all statistical results associated with this figure.

