
Figure 3.
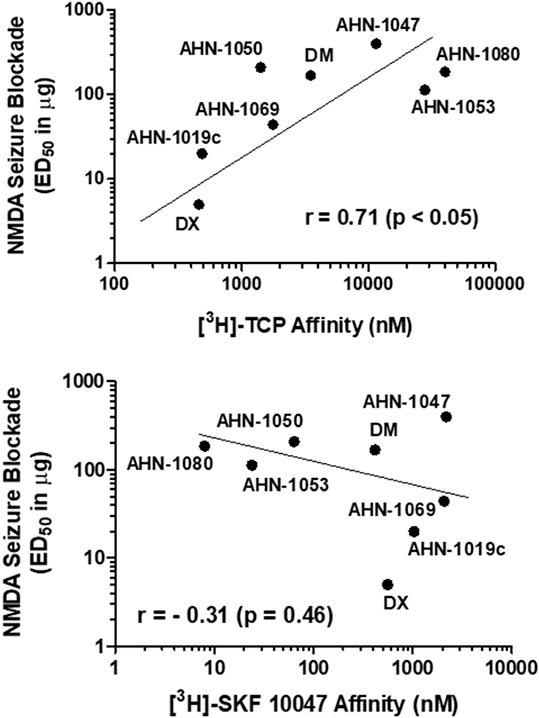
Relationship of NMDA ion channel (top panel) or σ1 receptor (bottom panel) binding affinities to anticonvulsant potency. Each point represents the mean value for each of the dextromethorphan analogs studied as shown also in Table 1. Data for σ2 binding are not plotted since half of the compounds studied had affinities designated as >1000 or > 10000 nM (Table 1).