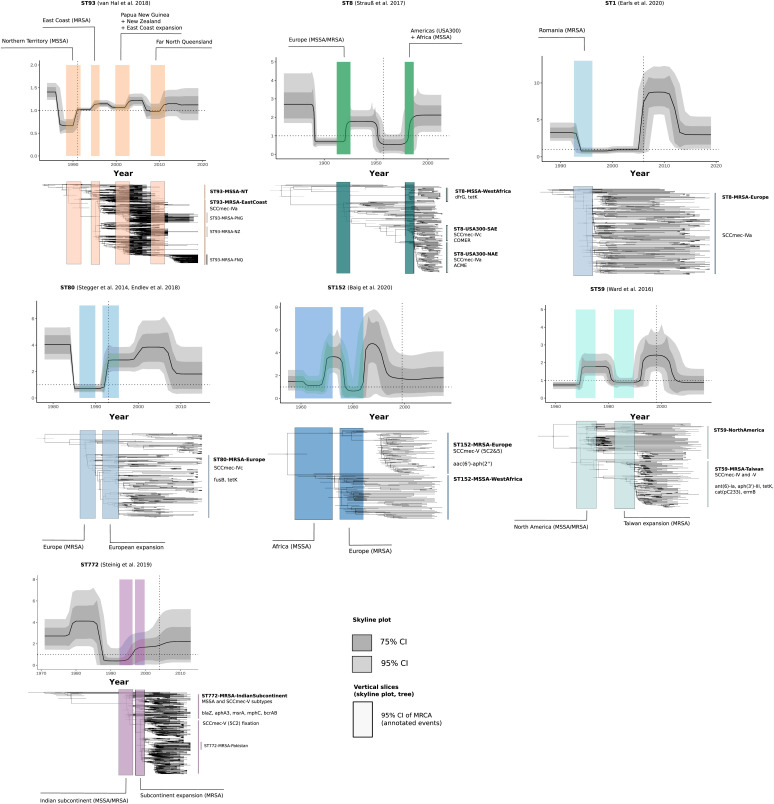
Fig. 4.
Bayesian phylogenetic trees and changes in the Re of global community-associated Staphylococcus aureus lineages with sufficient (n > 100) genotype-resolved data included in this study. Changes in Re estimated over equally sliced intervals in the birth–death skyline model are shown in the skyline plots. Trajectories of Re show the median posterior estimates over time (dark line) and their 95% credible intervals (dark gray) and 75% credible intervals (light gray). Colored rectangles show the 95% credible interval of the MRCA of clade divergences or demographic events (annotation) and are linked to time-scaled Bayesian maximum credibility trees beneath the plots. Location of the rectangles in the trees is aligned with the 95% credible intervals of node dates. Trees and rectangles were scaled and aligned manually to show their association with the skyline plots. Important sublineages and clades, as well as AMR elements or genes and mobile elements (COMER, ACME) associated with clade emergence are highlighted to the Right of the trees.

