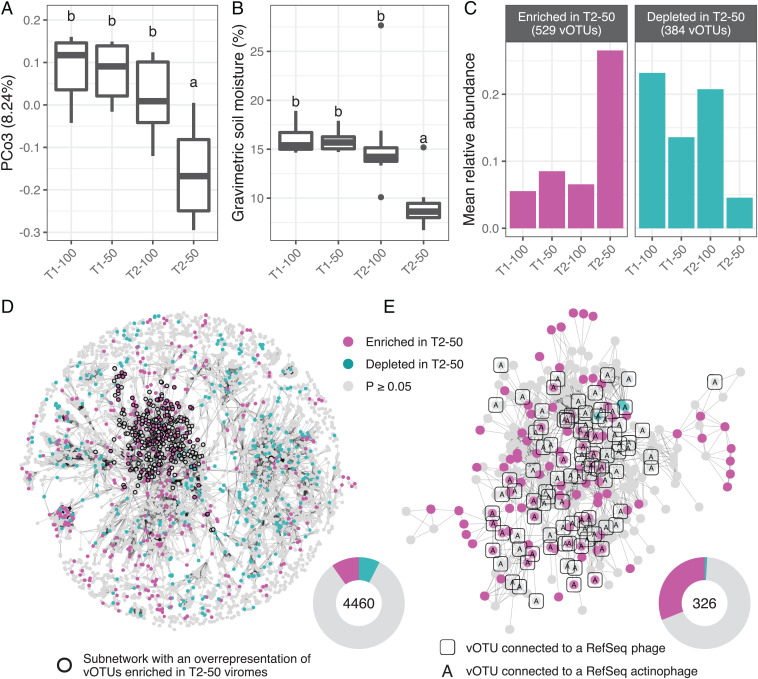
Fig. 3.
Viral community trends associated with soil moisture content. In A–C, samples are grouped along the x axis by collection time point (T1 and T2) and precipitation regime (100% and 50%). (A) Distribution of scores along the third axis of a PCoA performed on vOTU Bray–Curtis dissimilarities. The y axis label indicates the percentage of total variance explained. The first two axes of the same analysis are shown in Fig. 1B. (B) Gravimetric soil moisture contents. Boxes display the median and interquartile range (IQR), and data points farther than 1.5× IQR from box hinges are plotted as outliers. In A and B, different letters indicate significantly different sample groupings (P < 0.05), as determined by two-tailed Tukey’s range tests. (C) Summed mean relative abundances of the sets of vOTUs detected as indicator species differentiating T2-50 communities from the rest of the viromes. Facets distinguish indicator vOTUs that were relatively enriched or depleted, respectively, in T2-50 viromes. (D) Gene-sharing network displaying significant overlaps in predicted protein content (edges) between vOTUs (nodes). Node color shows whether a vOTU was an indicator species enriched or depleted in T2-50 samples or not an indicator species (defined by P values below or above 0.05, respectively, from an indicator value permutation test). Bold outlines highlight a subnetwork of all local neighborhoods with a significant overrepresentation of vOTUs enriched in T2-50 viromes (SI Appendix, Fig. S6 B and C). (E) Zoomed-in version of the subnetwork highlighted in D. Nodes surrounded by squares correspond to vOTUs with a significant overlap in their predicted protein contents with any of 971 RefSeq phage genomes, according to the network analysis shown in SI Appendix, Fig. S8. All such RefSeq phage genomes with significant links to this subnetwork were from phages isolated on Actinobacteria hosts, indicated by tagging vOTU nodes linked to RefSeq actinophages with the letter “A.” In D and E, inset donut plots on the lower right show the total number of vOTUs in the displayed network (center), along with the proportions of the indicator and nonindicator vOTUs in that network (fractions of the circle). Network visualization layouts were generated with the Fruchterman–Reingold algorithm.

