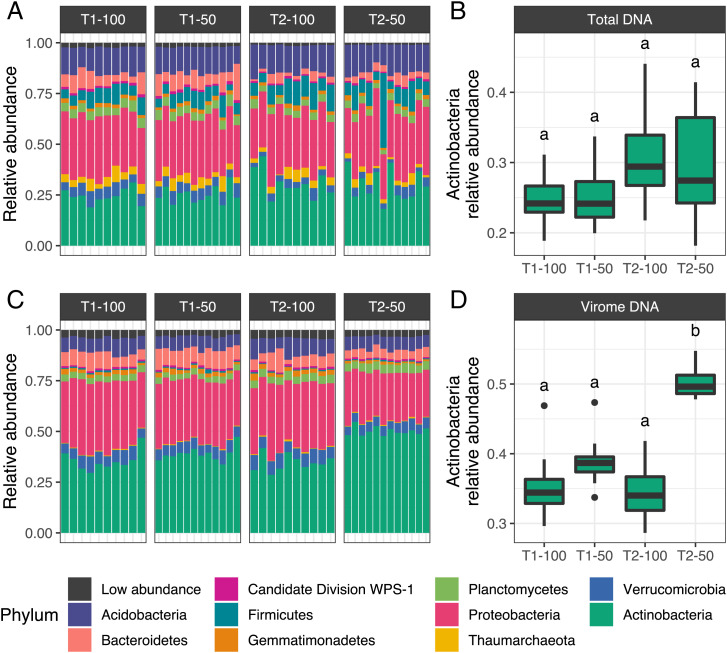
Fig. 4.
Abundance patterns of actinobacteria in total and relic DNA profiles. (A and C) Phylum abundances in 16S rRNA gene profiles from (A) total DNA 16S rRNA gene amplicon libraries and (C) virome DNA libraries. Each stacked bar plot corresponds to a sample, and the 10 most abundant phyla are colored. All other phyla are grouped in the “Low abundance” category. (B and D) Relative abundances of actinobacteria in (B) total DNA 16S rRNA gene amplicon libraries and (D) virome DNA libraries. Samples are organized by collection time point (T1 and T2) and precipitation treatment regime (100% and 50%). Boxes display the median and interquartile range (IQR), and data points farther than 1.5× IQR from box hinges are plotted as outliers. Letters above boxes indicate significantly different groupings (P < 0.05), as determined by pairwise Wilcoxon’s rank-sum tests. For C and D, abundances were normalized to the number of reads classified as 16S rRNA genes in each virome profile; a complementary analysis with abundances normalized to the total number of reads in each virome profile is provided in SI Appendix, Fig. S10.

