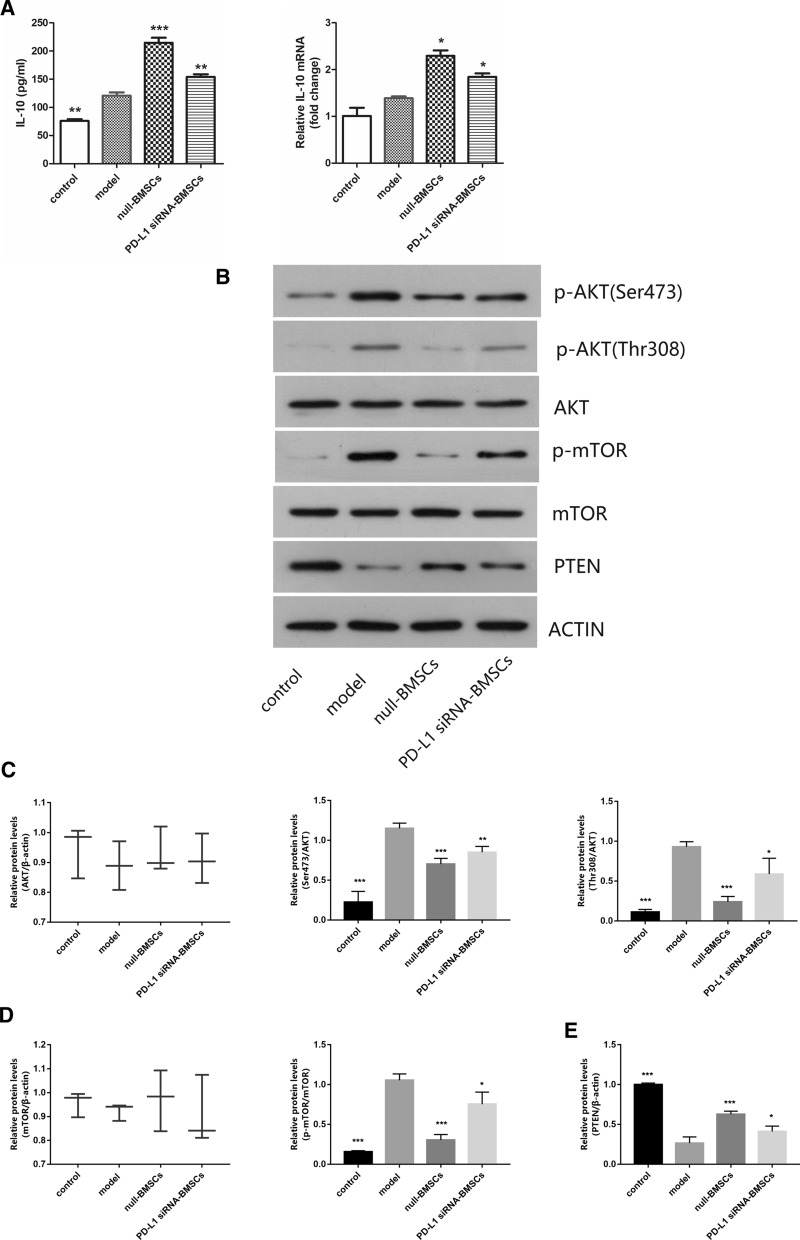
Fig. 5.
A Levels of IL-10 in colon tissues of each group were measured by enzyme-linked immunosorbent assay (Elisa) and quantitative real-time polymerase chain reaction (qRT-PCR) analyses of IL-10 mRNA expression in colons. B Western blotting analysis of phosphor-Akt (Ser473),phosphor-Akt (Thr308),AKT, phosphor-mTOR,mTOR and PTEN protein. C Levels of Ser473 protein and Thr308 protein in colon tissues of each group. D Levels of phosphor-mTOR protein in colon tissues of each group. E Levels of PTEN protein in colon tissues of each group. Data are expressed as means ± SD (n = 3). *P < 0.05,**P < 0.01, ***P < 0.001 vs. model group

