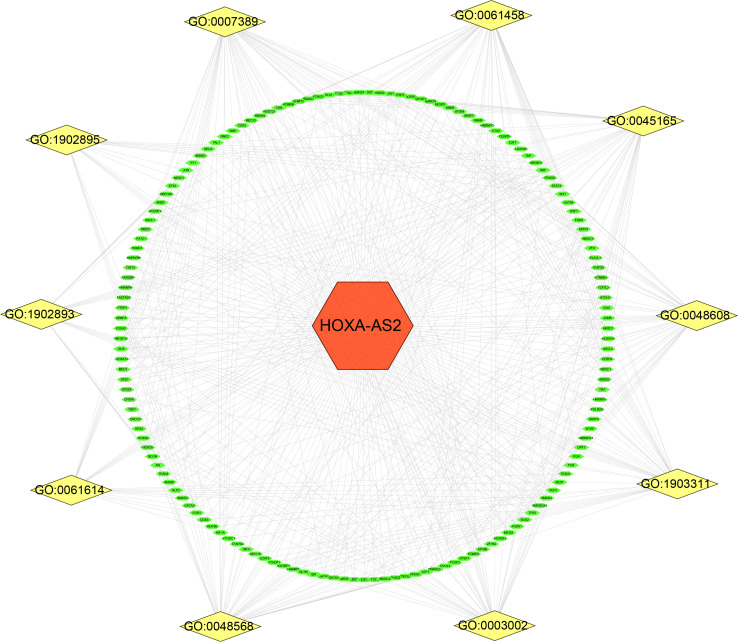
Figure 6.
Related gene interaction network analysis. Yellow nodes represent the related pathway and green nodes represent target genes. GO:0061614 (pri-miRNA transcription by RNA polymerase II); GO:1902893 (regulation of pri-miRNA transcription by RNA polymerase II); GO:0045165 (cell fate commitment); GO:1902895 (positive regulation of pri-miRNA transcription by RNA polymerase II); GO:0007389 (pattern specification process); GO:1903311 (regulation of mRNA metabolic process); GO:0003002 (regionalization); GO:0048568 (embryonic organ development); GO:0048608 (reproductive structure development); GO:0061458 (reproductive system development).

