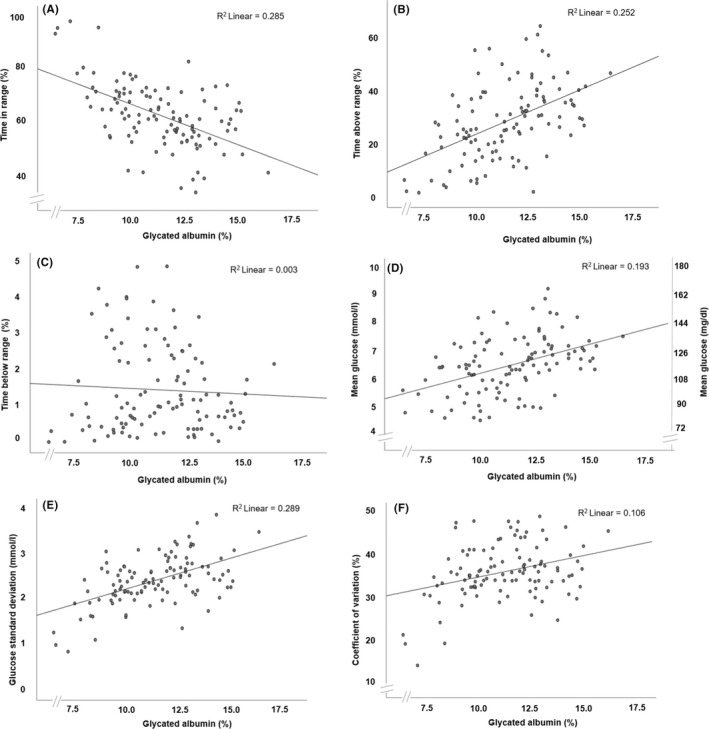
FIGURE 3.

Scatterplots indicating the association between glycated albumin with CGM metrics. (A) Time in range: 63–140 mg/dl (3.5–7.8 mmol/L). (B) Time above range: >140 mg/dl (>7.8 mmol/L). (C) Time below range: <63 mg/dl (<3.5 mmol/L). (D) Mean glucose. (E) Glucose standard deviation. (F) Coefficient of variation. CGM metrics are calculated from 103 14‐days periods with >70% coverage. CGM, continuous glucose monitoring; R 2, coefficient of determination
