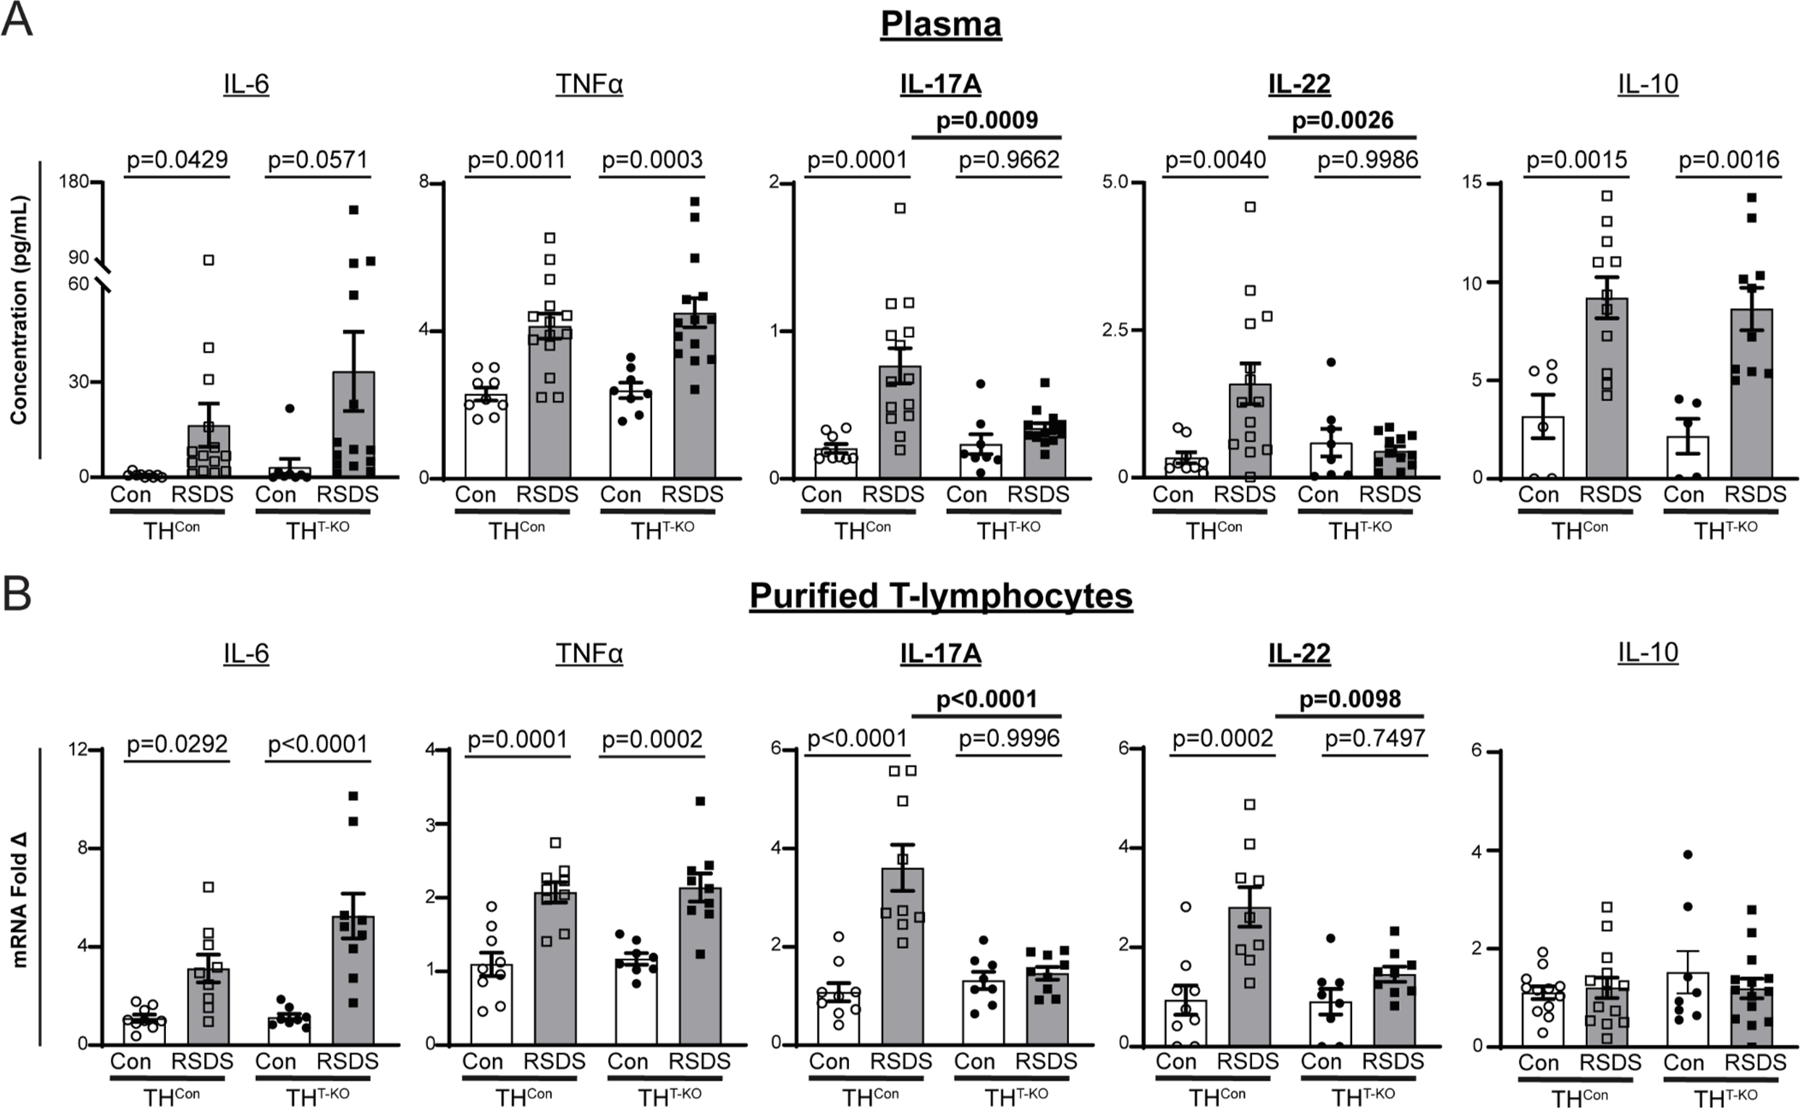
Fig. 3.

T-lymphocyte TH knockout selectively attenuates IL-17A and IL-22 cytokine levels. A) Circulating cytokines were assessed following control or RSDS paradigms with Meso Scale Discovery TH17 (Combo 2) assay. IL-6 Two-way ANOVA results, Stress p = 0.0173, genotype p = 0.2997, interaction 0.4460; TNFα Two-way ANOVA results, Stress p < 0.0001, genotype p = 0.5229, interaction 0.7110; IL-17A Two-way ANOVA results, Stress p = 0.0004, genotype p = 0.0213, interaction p = 0.0089; IL-22 Two-way ANOVA results, Stress p = 0.0304, genotype p = 0.0442, interaction 0.0065. N = 9, 8, 14, 14 for respective genotypes and treatments. B) Splenic T lymphocytes were isolated by magnetic negative selection, followed by RNA extraction, cDNA conversion, and real-time qPCR. All ΔCT values normalized to 40S ribosomal protein S18 (RPS18) control, then fold change normalized to THCon Control animals. IL-6 Two-way ANOVA results, Stress p < 0.0001, genotype p = 0.0619, interaction 0.0733; TNFα Two-way ANOVA results, Stress p < 0.0001, genotype p = 0.6486, interaction 0.9768; IL-17A Two-way ANOVA results, Stress p < 0.0001, genotype p = 0.0019, interaction p = 0.0002; IL-22 Two-way ANOVA results, Stress p = 0.0001, genotype p = 0.0190, interaction 0.0200. N = 9, 8, 9, 9 for respective genotypes and treatments. Two-way ANOVA Šidák multiple comparison tests of interest are listed if respective group or interaction effects were found to be significant.
