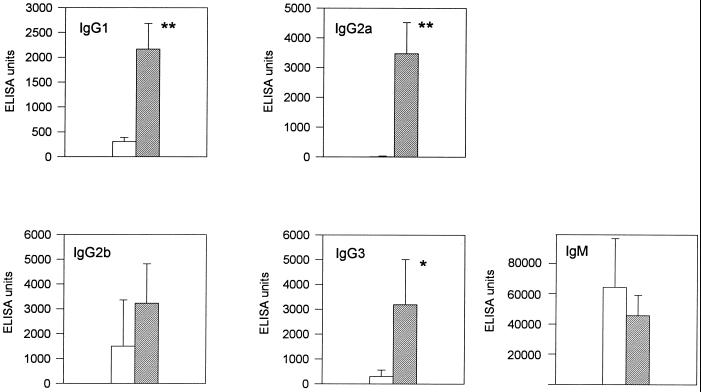
FIG. 9.
Analysis of IgG and IgM responses against B. pseudomallei antigens of BALB/c (open bars) and C57BL/6 (solid bars) mice at day 11 after intravenous infection with 2 × 10² CFU of B. pseudomallei E8. Values are given as the mean ± SD for five to six mice. Asterisks indicate significant (∗, P < 0.05; ∗∗, P < 0.001) differences between the two strains of mice.

