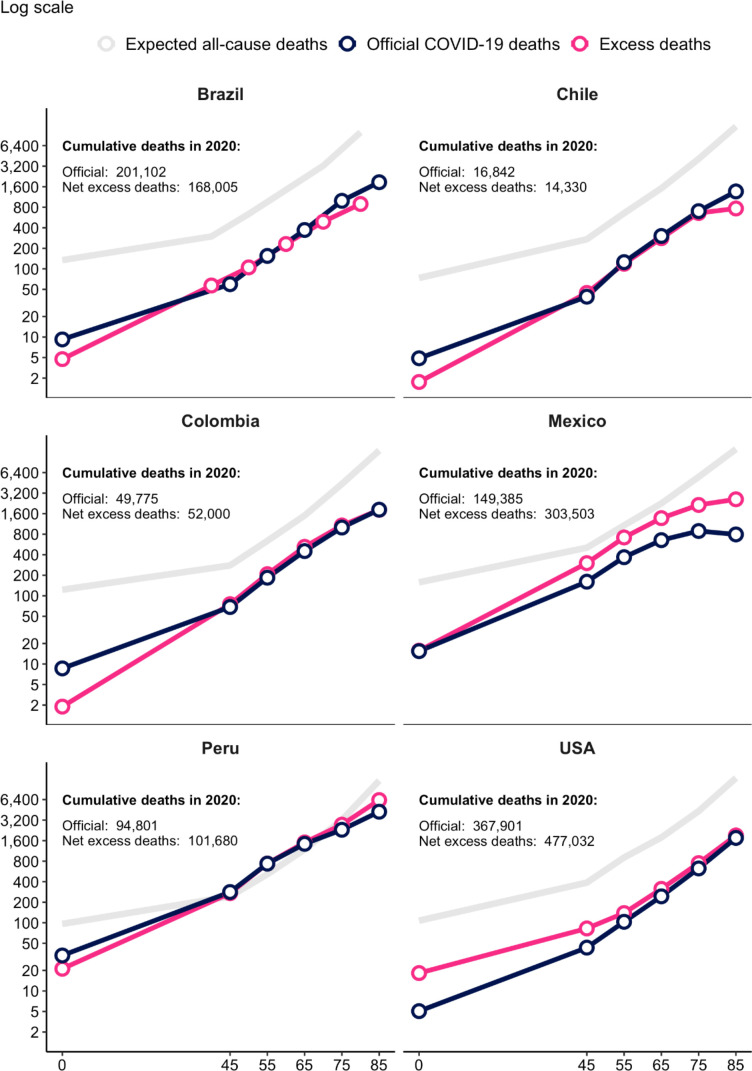
Figure 5.
Official COVID-19 versus excess deaths by age group, select Latin-American countries and the USA (per 100 000 population). Note: Points are plotted at the start of each age group: 0–44 years, 45–54 years, 55–64 years, 65–74 years, 75–84 years, 85+ years. Brazil has different age group categories. The excess mortality calculation for Chile is based on the first 52 weeks of the International Organization for Standardization (ISO) calendar year and thus excludes the last 4 days of the calendar year.

