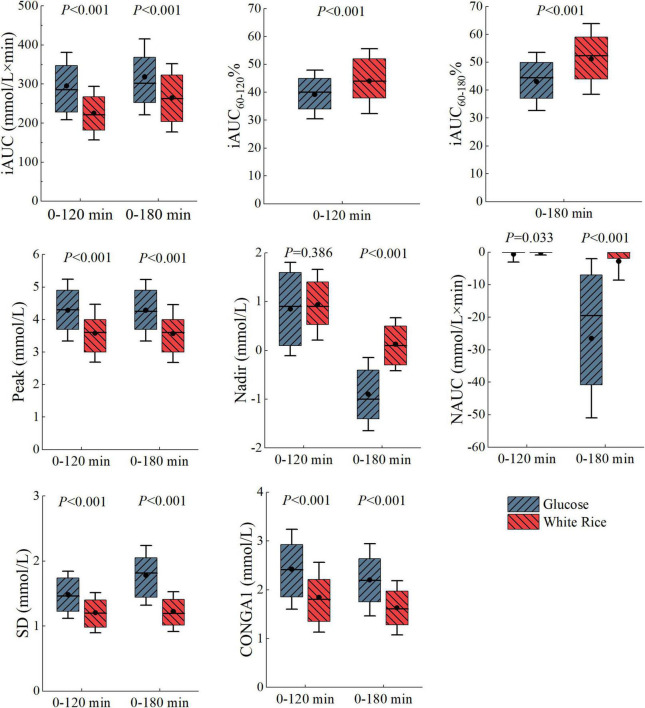
FIGURE 3.
Boxplot of glycemic parameters calculated over 180 and 120 min. The dots indicate the mean, the line indicate the media, top of the box indicate the 75th percentile, bottom of the box indicate the 25th percentile and the error bars indicate the mean ± SD. Statistical significance between white rice (WR) test and glucose (G) test is marked.

