FIGURE 4.

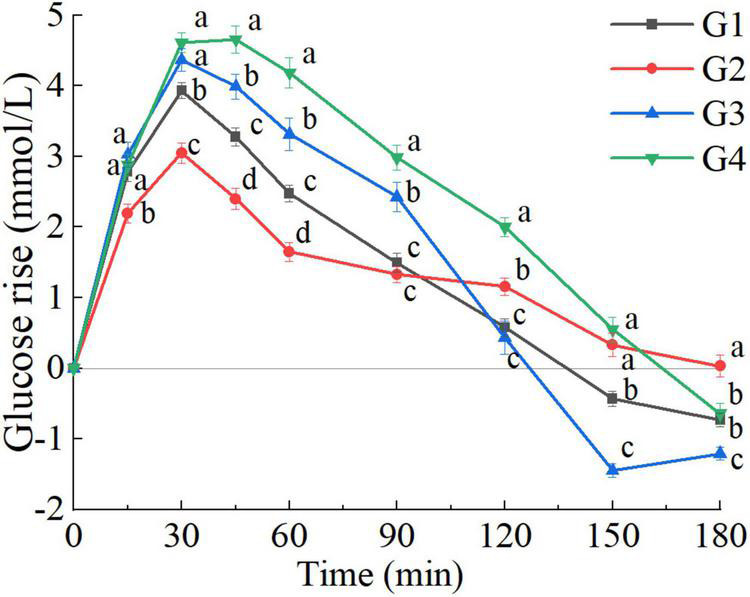
Postprandial glycemic response (PGR) to glucose of G clusters (G1, G2, G3, G4). a, b, c, d, used for comparison between subgroups at that time point (P < 0.05). The error bars indicate the mean ± SE.

Postprandial glycemic response (PGR) to glucose of G clusters (G1, G2, G3, G4). a, b, c, d, used for comparison between subgroups at that time point (P < 0.05). The error bars indicate the mean ± SE.