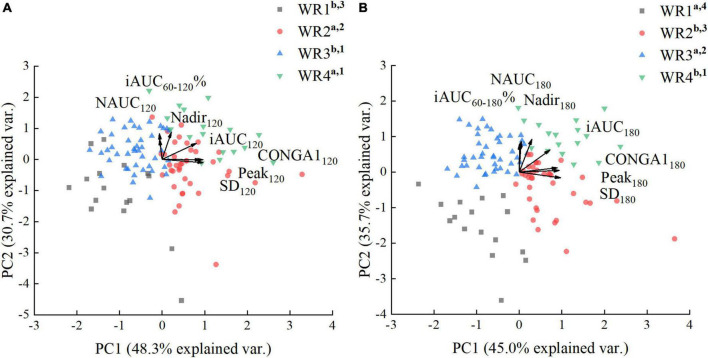
FIGURE 7.
Principal factor analysis loading and score plots of white rice (WR) clusters. (A) Principal factor analysis (PFA) based on parameters calculated over 120 min. (B) PFA based on parameters calculated over 180 min. The loadings of the parameters are shown with arrows, and the scores of the participants are shown as dots in the background. a, b, c used for comparison of PC1 scores (P < 0.05). 1–4, used for comparison of PC2 scores (P < 0.05).

