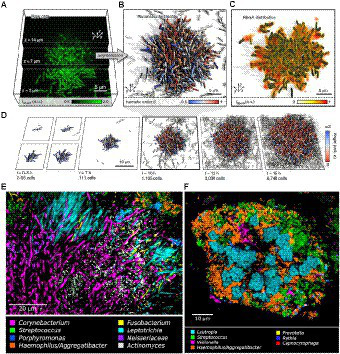
Figure 1.

Biofilm growth and structure. (A) Confocal microscopy images of Vibrio cholerae cells constitutively expressing a green fluorescent protein at three different z planes. (B) 3D reconstruction of the biofilm shown in (A), cells are colored according to the nematic order parameter S = <3_2 (n_i _ n_j) −1_2 > 2 in its vicinity. High-time-resolution (Δt = 5–10 min) imaging allows tracking of cell lineages. White cells are not direct descendants of the biofilm founder cell. (C) Shows the extracellular matrix protein RbmA that mediates cell–cell adhesion and is distributed throughout the biofilm. (D) Biofilm growth series over time. Starting from initial attachment to irreversible attachment, maturation and dispersion. Cells are colored according to the cellular alignment with the z axis (Hartmann et al., 2019). (E) Localization of Actinomyces within hedgehogs, in patches within the base region of hedgehogs, and adjacent to them in a dental plaque microbiome. (F) Cauliflower structure in plaque composed of Lautropia, Streptococcus, Haemophilus/Aggregatibacter, and Veillonella. Scattered cells of Prevotella, Rothia, and Capnocytophaga are also visible (Welch et al., 2016). These figures were reproduced with permission from Hartmann et al. (2019).
