Figure 3.

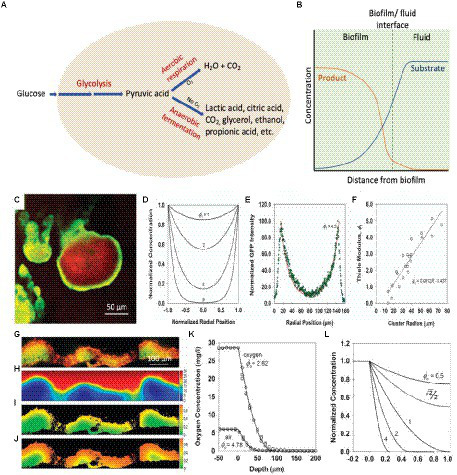
Mechanisms of local acidosis and hypoxia with the comparison between reaction–diffusion simulations and experiments. (A) Schematic diagram of cellular glucose metabolic pathways resulting in acidic metabolites. (B) Concentrations of the metabolic substrate and metabolic product with distance from the biofilm. (C) The pattern of GFP expression (green) and biomass counterstain (red) in a cell cluster demonstrating a growth rate gradient within a biofilm. The scale bar represents 50 μm (Stewart et al., 2016). (D) Calculated concentration profiles of a substrate in a hemispherical cluster for varying values of the Thiele modulus, ϕ1 under first-order reaction kinetics (Stewart et al., 2016). (E) Fit of a theoretical curve (ϕ1 = 4.5) fitted to an experimental GFP intensity (Stewart et al., 2016). (F) Determination of Thiele modulus by fitting experimental data versus cluster radius (Stewart et al., 2016). (G) The relative growth rate of a biofilm using acridine orange-stained frozen section (red/orange represent regions of relatively rapid growth; green/yellow regions represent slow growth). The scale bar represents 100 μm (Wentland et al., 1996; Stewart et al., 2016). (H) Simulated glucose concentration in mg L−1 (bulk fluid glucose concentration of 30 mg L−1; Stewart et al., 2016). (I) Simulated growth rate in h−1 (bulk fluid glucose concentrations of 10 mg L−1; Stewart et al., 2016). (J) Simulated growth rate in h−1 (bulk fluid glucose concentrations of 25 mg L−1; Stewart et al., 2016). (K) Experimental oxygen concentration profile in a biofilm (gray circles – exposed to air, open circles – exposed to oxygen-enriched gas, solid lines – theoretical curves fitted to two data sets; Stewart et al., 2016). (L) Theoretical concentration profile for a metabolic substrate with varying values of Thiele modulus, ϕo, under zero-order reaction kinetics (Stewart et al., 2016). These figures were reproduced with permission from Stewart et al. (2016) and Wentland et al. (1996).
