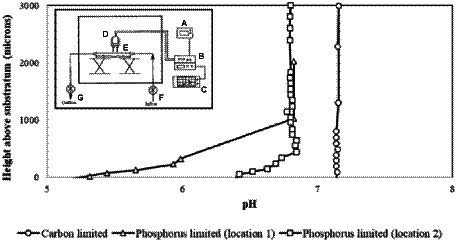
Figure 4.

The specimen pH profile of Citrobacter biofilm. The circle denotes the specimen pH profile of a Citrobacter biofilm pre-grown and measured under carbon limitation; measurements were recorded under laminar flow (9.5 ml/min). The electrode penetrated through the biofilm to the substratum. The square and triangle denote the specimen pH profiles of two locations measured in a Citrobacter biofilm pre-grown under carbon limitation and then imaged with a phosphorus limiting medium; laminar flow conditions were the same. The profiles suggest that the diffusion boundary layer is approximately 400 mm in depth. The inset illustrates the overview of the pH microelectrode measurement set-up; (A) power supply, (B) preamplifier, (C) chart recorder, (D) measurement electrode and reference electrode, (E) glass culture flow cell, (F) culture inflow, (G) culture outflow. Data digitized and replotted from Allan et al. (1999).
