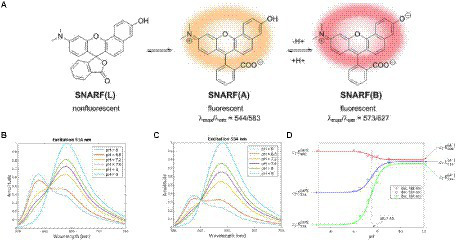
Figure 5.

Fluorescent pH indicator dye sensing mechanism. (A) pH-dependent molecular equilibria structures of pH indicator dye SNARF derivative (SNARF-OH; Nakata et al., 2014). (B) Fluorescence emission spectra of C-SNARF-1 (5-(and-6)-Carboxy SNARF®-1) at 514 nm (Kateklum et al., 2018). (C) Emission spectra of C-SNARF-1 at 534 nm (Kateklum et al., 2018). (D) Mathematical modeling of C-SNARF-1 emission wavelength as a function of pH (Kateklum et al., 2018). These figures were reproduced with permission from Nakata et al. (2014) and Kateklum et al. (2018).
