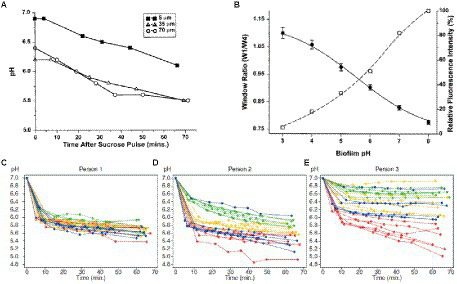
Figure 6.

Time-dependent pH in oral biofilm after sucrose addition. (A) In a mixed culture of 10 oral bacteria grown in a chemostat system, the mean biofilm pH in a 100-μm biofilm decreased following a sucrose pulse at depths of 5, 35, and 90 μm from biofilm-coverslip assembly (Vroom et al., 1999). (B) Graph of window ratio (W1/W4) vs. biofilm pH (solid line); graph of relative fluorescence intensity of carboxyfluorescein as a function of pH (dashed line; Vroom et al., 1999). (C–E) Extracellular pH curves of three individuals with different pH drop patterns in the sucrose-free group from 1-h experiment. Each curve shows the average pH of a field of view; different specimens are represented by the different colors (depth of biofilm: 10–35 μm; Dige et al., 2016). These figures were reproduced with permission from Vroom et al. (1999) and Dige et al. (2016).
