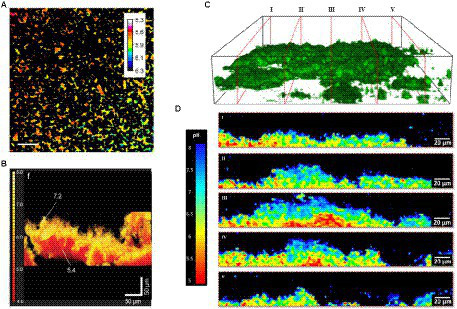
Figure 7.

pH variation in biofilms measured via fluorescence. (A) Extracellular pH landscape in the model biofilm exposed to sterile saliva with 0.4% (w/v) glucose and C-SNARF-4 (pH-sensitive ratiometric probe). The scale bar represents 20 μm (Schlafer et al., 2011). (B) Functional 3-D tomographic imaging of side volumetric projections of the reconstructed biofilm pH map of E. coli (Hidalgo et al., 2009). (C) Representative 3D CLSM reconstruction of axial pH distribution within intact microcolony of P. fluorescens biofilms, showing orthogonal slices I-V (Fulaz et al., 2019). (D) Corresponding ratiometric orthogonal slices from (C) showing spatially distinct pH gradients in the y, z direction within microcolonies of P. fluorescens biofilms. Scale bars represent 20 μm (Fulaz et al., 2019). These figures were reproduced with permission from Schlafer et al. (2011), Hidalgo et al. (2009), and Fulaz et al. (2019).
