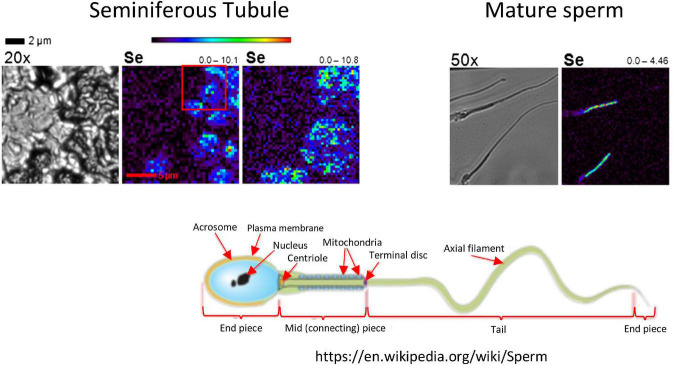
FIGURE 2.
Localization of Se in mouse testis by x-ray fluorescence microscopy (XFM). In the left-hand images, a seminiferous tubule is visualized in cross section at 20×. Se (bright blue to green) localizes to elongating spermatids. In the right-hand images, Se in mature sperm localizes to the mid-piece, which is the location of sperm mitochondria (see the schematic of a mature sperm, lower right). The range below the seminiferous tubule image indicates the low and high concentrations of Se in ng/cm2. Modified, with permission, from Kehr et al. (24).

