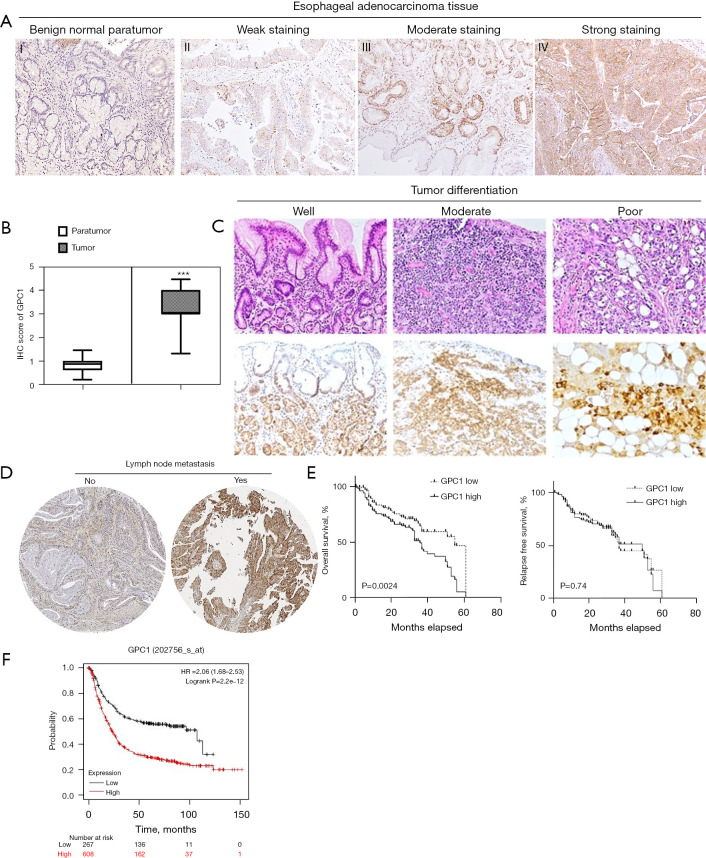
Figure 1.
GPC1 is overexpressed in human EGAC. (A) Representative immunohistochemical staining of GPC1 in normal paratumor tissue (I) and human EGAC tissues (II, III, IV) showing variable intensity of GPC1 staining. Tissue sections were stained with anti GPC1 antibody followed by counterstaining with hematoxylin and eosin and visualized under light microscope with 40× magnification. (B) GPC1 IHC score in normal paratumor tissue and tumor tissue. Data represent mean histological score (IHC score) ± SD, ***, P<0.001. (C) GPC1 expression according to the degree of differentiation of tumor (HE and immunohistochemical staining, 20× magnification). (D) GPC1 expression in tumor tissue with lymph node metastasis (immunohistochemical staining, 20× magnification). (E) KM plot based on level of GPC1 expression in tumor tissue. (F) KM survival plot in KM plotter database estimating survival in 875 patients with EGAC. Red line: patients with high GPC1 (n=704); black line: low expression GPC1 patients (n=171). High GPC1 patient group was associated with decreased overall survival (P=2.2e−12, 706 log-rank test). GPC1, glypican 1; EGAC, esophagogastric cancer; IHC, immunohistochemistry; SD, standard deviations; HE, hematoxylin and eosin; KM, Kaplan-Meier.

