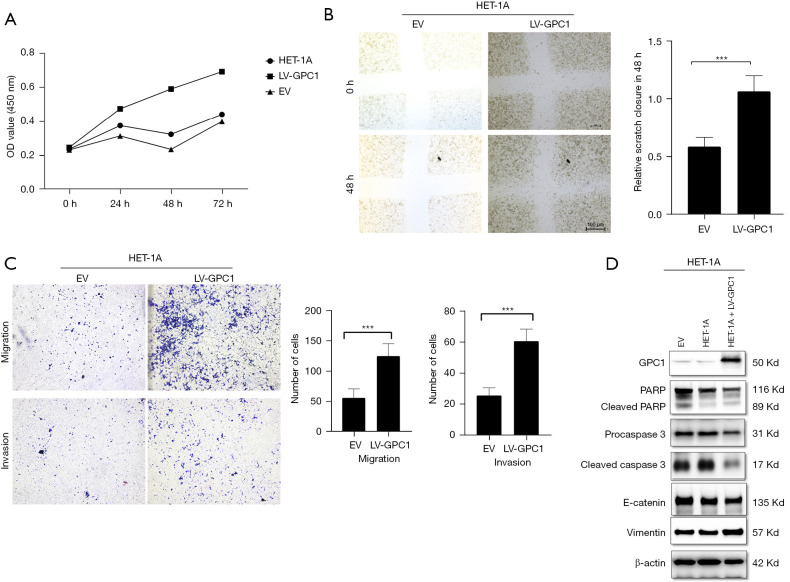
Figure 13.
Overexpression of GPC1 in normal HET-1A cells enhanced cell proliferation, suppressed apoptosis and enhanced migration and invasion. (A) HET-1A cells were transfected with LV-GPC1 and cell proliferation was measured by CCK-8 assay. (B) Light microscopy images (magnification 20×) of scratch assay from indicated groups at 0 and 48 h after transfection. The bar chart represents mean ± SD of scratch wound closure compared to 0 h width. n=3, ***, P<0.01. (C) Light microscopy images (magnification 20×) of Transwell assay in either uncoated (migration) or matrigel coated (invasion) polycarbonate 8 μm chambers. Migrated cells at the bottom of inserts were stained with 0.1% crystal violet. Bar chart showing the number of migrated cells. Data represents n=3, mean ± SD number of invaded cells in 5 objective fields, ***, P<0.001. (D) Western blot assay showing protein expression of pro-PARP, cleaved PARP, procaspase3, cleaved caspase3, E-cadherin and Vimentin in HET-1A and GPC1 overexpressed HET-1A cells. β-actin loading control. OD, optical density; LV-GPC1, overexpressing GPC1 lentivirus; EV, empty vector control; GPC1, glypican 1; SD, standard deviations; PARP, poly(ADP-ribose) polymerase 1.

