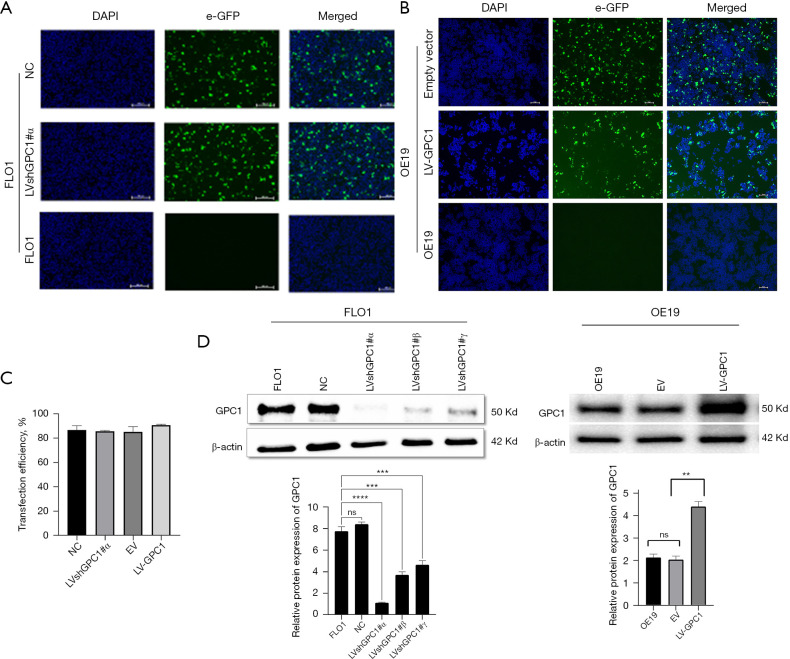
Figure 3.
Validation of efficient knockdown and overexpression of GPC1 with lentivirus. (A) Fluorescent microscopy images of GPC1 knockdown FLO1 cells and negative control. (B) Fluorescent microscopy images of GPC1 overexpressed OE19 cells and empty vector. (C) Bar chart showing transfection efficiencies for lentiviral plasmids in FLO1 and OE19 cells. Western blot and densitometry analysis of GPC1 after knockdown of FLO1 cells with LVshGPC1#α, LVshGPC1#β, and LVshGPC-1#γ in FLO1 cells and GPC1 overexpression with LV-GPC1 in OE19 cells. β-actin loading control. Fold change of GPC1 expression was normalized to the expression of control cells. Scale bar: 50 µm. Data represent mean ± SD. n=3. **, P<0.005, ***, P<0.001, ****, P<0.0001 compared with control. LVshGPC1#α, LVshGPC1#β, and LVshGPC-1#γ, GPC1 knockdown plasmids; NC, negative scrambled control; DAPI, 4',6-diamidino-2-phenylindole-stained DNA; e-GFP, enhanced green fluorescent protein; EV, empty vector control; LV-GPC1, overexpressing GPC1 lentivirus; GPC1, glypican 1; SD, standard deviations.

