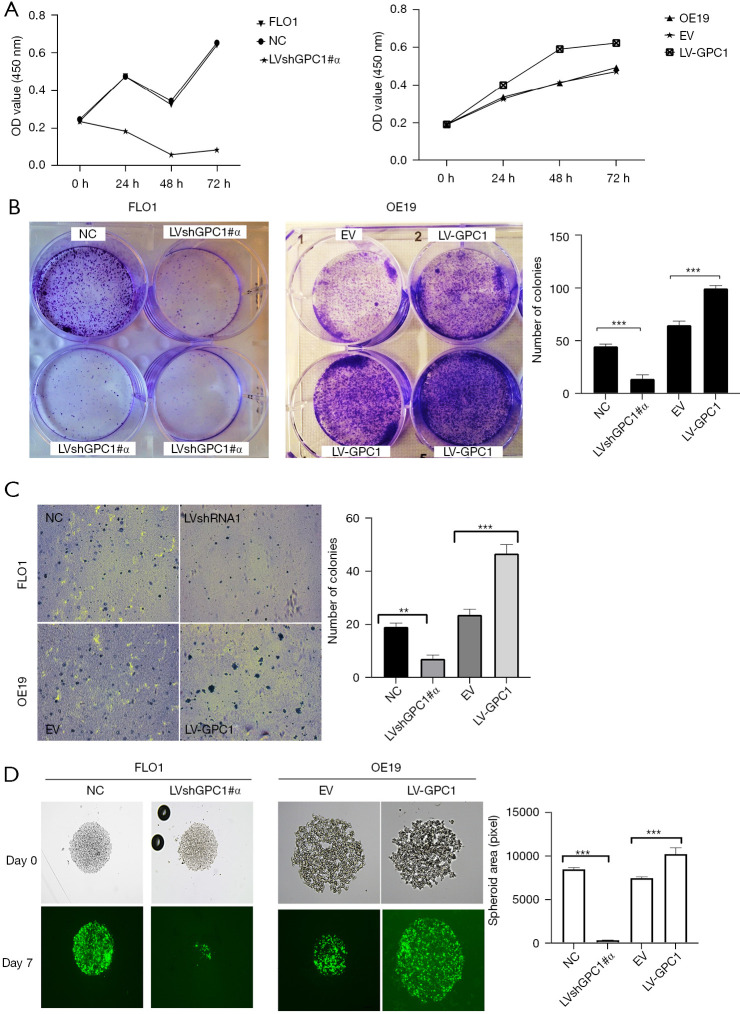
Figure 5.
GPC1 promotes EGAC cell proliferation in vitro (A) CCK-8 assay determination of proliferation of cells after GPC1 knockdown (left) and GPC1 overexpression in FLO1 and OE19 cells respectively. (B) Representative images of anchorage dependent colony formation. FLO1 and OE19 cells were seeded in 6 well plates and treated with either negative control, GPC1 knockdown, empty vector or GPC1 overexpression plasmid and grown for 14 days. Colonies were stained with 0.1% crystal violet and visualized under microscope at 40× magnification. Bar chart represents mean ± SD values for number of colonies in indicated groups (n=3, ***, P<0.001). (C) Representative image (left) and bar chart (right) of soft agar colony formation after transfection of cells with LVshGPC1#α and LV-GPC1 grown in soft agar for 14 days, stained with 0.5% crystal violet and visualized under microscope at 40× magnification (**, P<0.01; ***, P<0.001). (D) Representative images and bar chart of sphere formation capacity of GPC1 knockdown and overexpressed cells in matrigel at 100× magnification. Bar chart represents mean ± SD values for number of colonies in indicated groups. n=3, ***, P<0.001. OD, optical density; NC, negative scrambled control; LVshGPC1#α, GPC1 knockdown plasmid; EV, empty vector control; LV-GPC1, overexpressing GPC1 lentivirus; GPC1, glypican 1; EGAC, esophagogastric cancer; SD, standard deviations.

