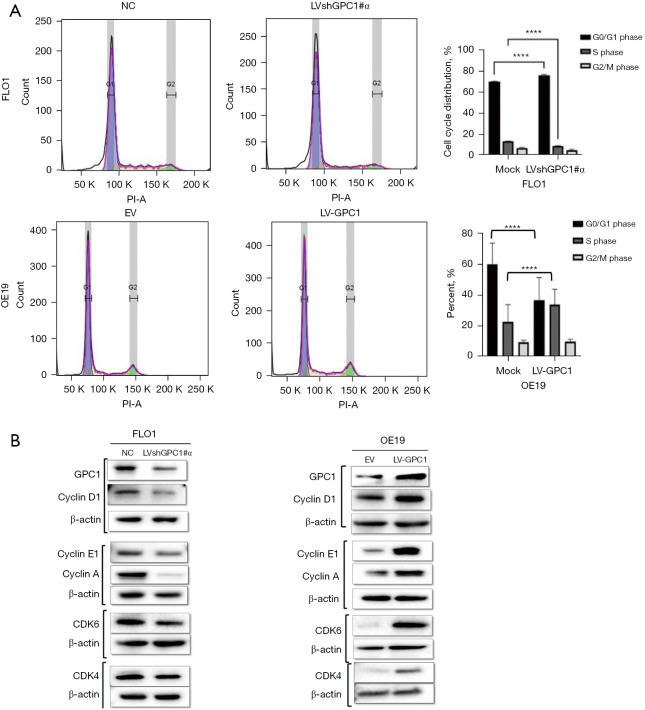
Figure 6.
GPC1 regulates cell cycle progression. Propidium iodide staining, and flow cytometry was performed after GPC1 knockdown and overexpression to assess distribution of cell cycle phases. (A) Cell cycle was arrested in G0/G1 phase after knockdown of GPC1 in FLO1 cells. GPC1 overexpression with LV-GPC1 in OE19 cells showed an increase in S phase. (B) Western blot analysis after knockdown and overexpression of GPC1 showing protein levels of key cyclins and cyclin dependent kinases. Beta actin was used as loading control. Representative images and quantification of cell phases are shown. Data are means from three experiments ± SD; ordinary one ANOVA with multiple comparisons, ****, P<0.0001. NC, negative scrambled control; LVshGPC1#α, GPC1 knockdown plasmid; PI-A, Propidium Iodide-Annexin; EV, empty vector control; LV-GPC1, overexpressing GPC1 lentivirus; GPC1, glypican 1; SD, standard deviations.

