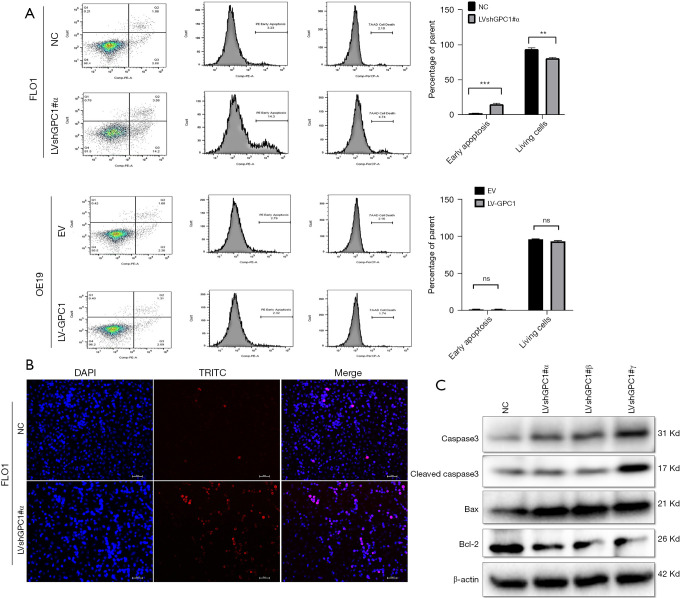
Figure 7.
GPC1 knockdown induced apoptosis. (A) After knockdown of GPC1 in FLO1 cells and overexpressing GPC1 in OE19 cells, they were double-stained with annexin FITC/PI and analyzed by flow cytometry. The percentage of apoptotic cells increased in GPC1 knockdown cells compared to controls. There was no difference in apoptosis after overexpression of GPC1 compared to control empty vector. Representative images, and a bar chart for quantification of the percentage of apoptosis (B) GPC1 knockdown FLO1 cells were visualized under a fluorescence microscope for TUNEL staining using a TUNEL/TRITC staining kit. Blue denotes DAPI, red denotes TRITC and pink denotes merged condensed chromatin within the nucleus. Scale bar: 50 µm. (C) Western blot assay of GPC1 knockdown FLO1 cell lysate showing protein levels of procaspase, cleaved caspase 3, Bax, and Bcl2. Beta actin was used as a loading control. Data represents n=3, mean ± SD; ordinary one ANOVA with multiple comparisons, **, P<0.01, ***, P<0.001. NC, negative scrambled control; LVshGPC1#α, GPC1 knockdown plasmid; EV, empty vector control; LV-GPC1, overexpressing GPC1 lentivirus; ns, not significant; DAPI, 4',6-diamidino-2-phenylindole-stained DNA; TRITC, tetramethylrhodamine; GPC1, glypican 1; FITC/PI, fluorescein isothiocyanate/Propidium Iodide; TUNEL, terminal deoxynucleotidyl transferase dUTP nick end labeling; SD, standard deviations.

