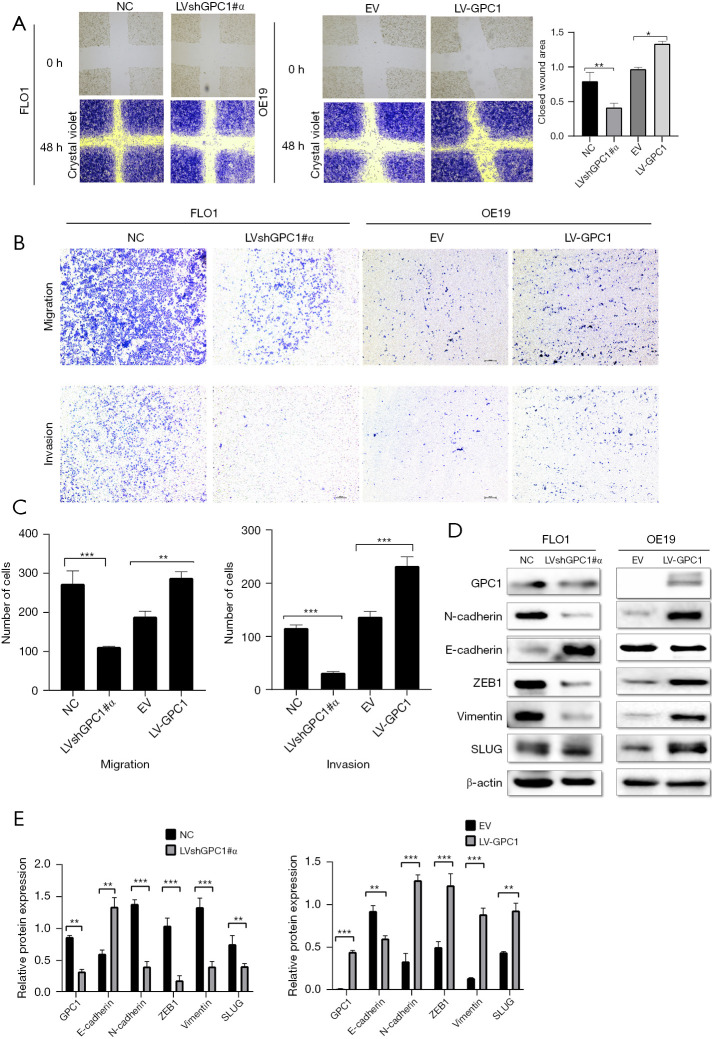
Figure 8.
GPC1 promotes cell migration, invasion, and epithelial mesenchymal transformation. (A) Light microscopy images (magnification 20×) of scratch assay taken at 0 and 48 h after transfection. The bar chart showing mean ± SEM of scratch width (relative to that at 0 h; n=3, ANOVA, *, P<0.05, **, P<0.01). (B) Light microscopy images (magnification 20×) of Transwell assay in either uncoated (for migration) or Matrigel coated (for invasion) polycarbonate 8 µm chambers. Migrated cells at the bottom of inserts were stained with 0.1% crystal violet. (C) Bar chart represents data from n=3, mean ± SD of number of migrated and invaded cells in 5 random fields (Student’s t-test, **, P<0.01, ***, P<0.001). (D) Western blot analysis of EMT proteins E-cadherin, N-cadherin, ZEB1, vimentin, in GPC1 knockdown FLO1 cells and GPC1 overexpressed OE19 cells. (E) Densitometry analysis of EMT proteins in GPC1knockdown FLO1 cells and GPC1 overexpressed OE19 cells versus respective controls. Data represent mean ± SD, n=3. **, P<0.01, ***, P<0.001. GPC1, glypican 1; NC, negative scrambled control; LVshGPC1#α, GPC1 knockdown lentivirus; EV, empty vector control; LV-GPC1, overexpressing GPC1 lentivirus; SEM, standard error of mean; ANOVA, analysis of variance; SD, standard deviations.

