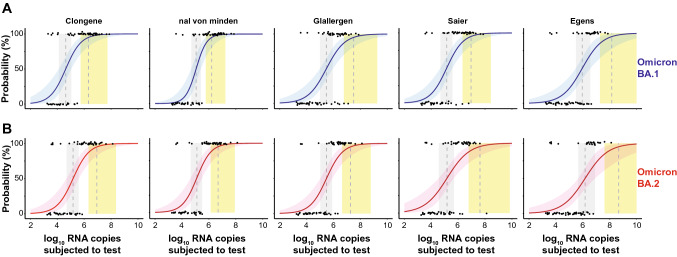
Fig. 2.
Limit of detection analyses of PCR-positive SARS-CoV-2 patient samples for five SARS-CoV-2 RATs. A top panels: Omicron-BA.1 dataset is shown in blue. B bottom panels: Omicron-BA.2 dataset shown in red. The log10 RNA copies subjected to the test on the x-axis was plotted against a positive (+ 1) or negative (0) test outcome on the y-axis. For readability of the figure, slight normal jitter was added to the y values. Red/blue curves show logistic regressions of the viral load on the test outcome; vertical dashed lines indicate log viral loads at which 50% (LoD50) and 95% (LoD95), respectively, of the samples are expected positive based on the regression results

